Hiding Date Field Drill-Down in Tableau
When a dashboard is built based on a specific date aggregation level, you can use Tableau’s custom date feature to prevent the drill-down button from appearing.

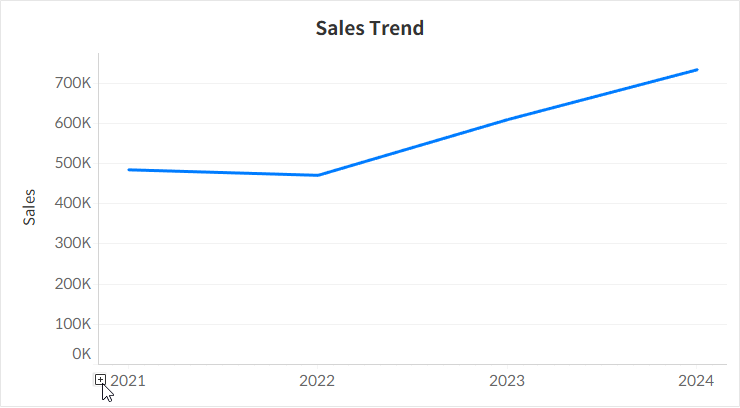
Tableau provides a default drill-down function for date fields, allowing users to easily change the level of date aggregation (e.g., year → quarter → month) and explore how metrics change over time.
If your dashboard is designed to compare metrics based on a fixed date level—such as year or month—this drill-down capability may confuse end users by allowing unintended changes in aggregation.
In such cases, Tableau’s Custom Date feature can be used to disable the drill-down button entirely.
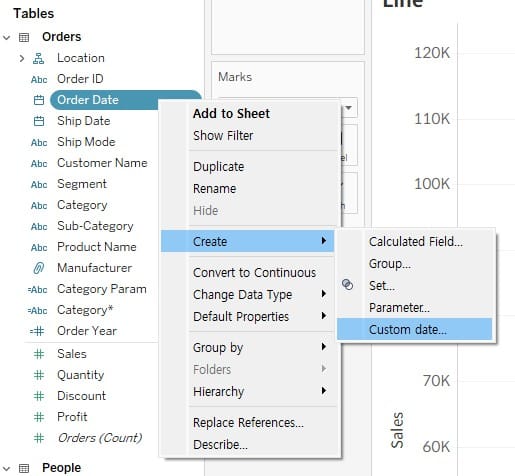
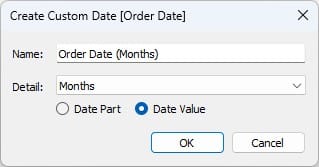
By creating a custom date field with a selected aggregation level, you can display date fields without the drill-down arrow.
During this process, remember that:
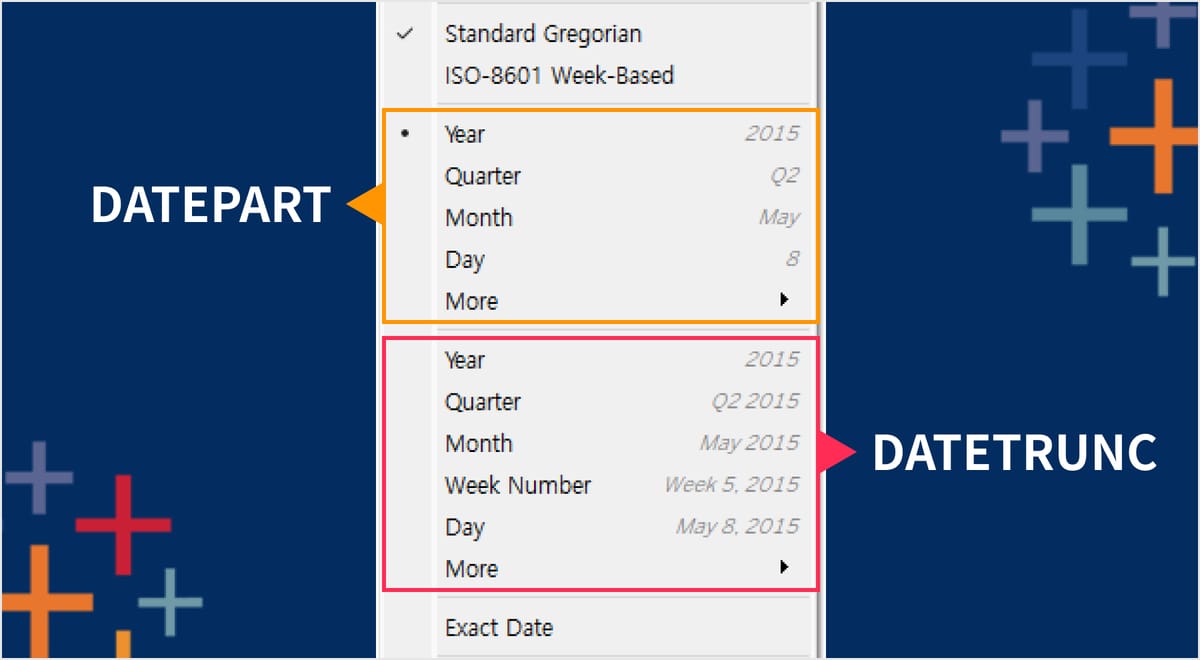
- Date Parts use the
DATEPARTfunction (discrete values like "January", "2024"), - Date Values use the
DATETRUNCfunction (continuous values like "2024-01-01").
For more details on the difference between these two options, please refer to our related post on date field aggregation in Tableau.