Using Map Chart in Tableau

Map chart are one of Tableau’s strengths and are highly useful for visualizing data that includes country or regional values. However, because map charts inherently convey geographic information in addition to the user’s data, they can be somewhat more restrictive compared to other chart types. In this post, we’ll look at which marks work best with map charts and what points to keep in mind when using them.
Use Accurate Locations
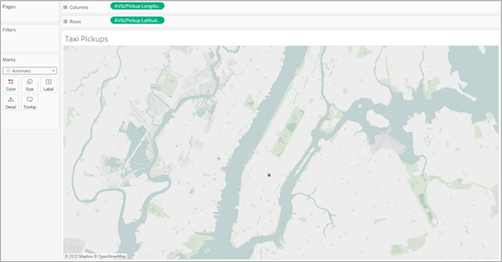
The most important factor in building map charts is, of course, using accurate location data. When working with personalized or specific locations, it’s essential to include precise latitude and longitude values so that data is placed correctly on the map.
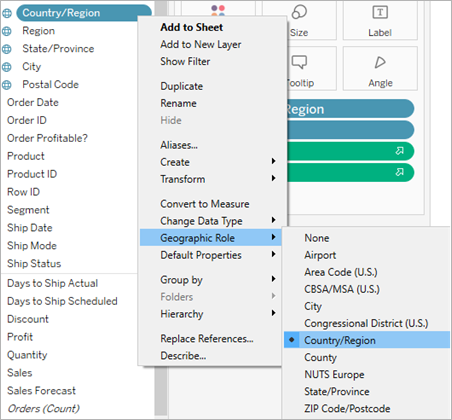
If you want to display globally standardized data such as country names, country codes, or airport codes, Tableau’s Geographic Role make this possible without requiring latitude and longitude. Keep in mind that the list of available Geographic Role changes depending on the file’s locale settings, so make sure to set the locale that matches your data.
Choose Marks That Match the Data
Map charts come with certain limitations on the marks that can be used. It’s important to choose the most suitable mark type from the list below to represent your data effectively:
- Circle or Shape: The most commonly used option. Measures can be represented with size and color. To prevent overlap, you can adjust transparency or add borders for better visibility.
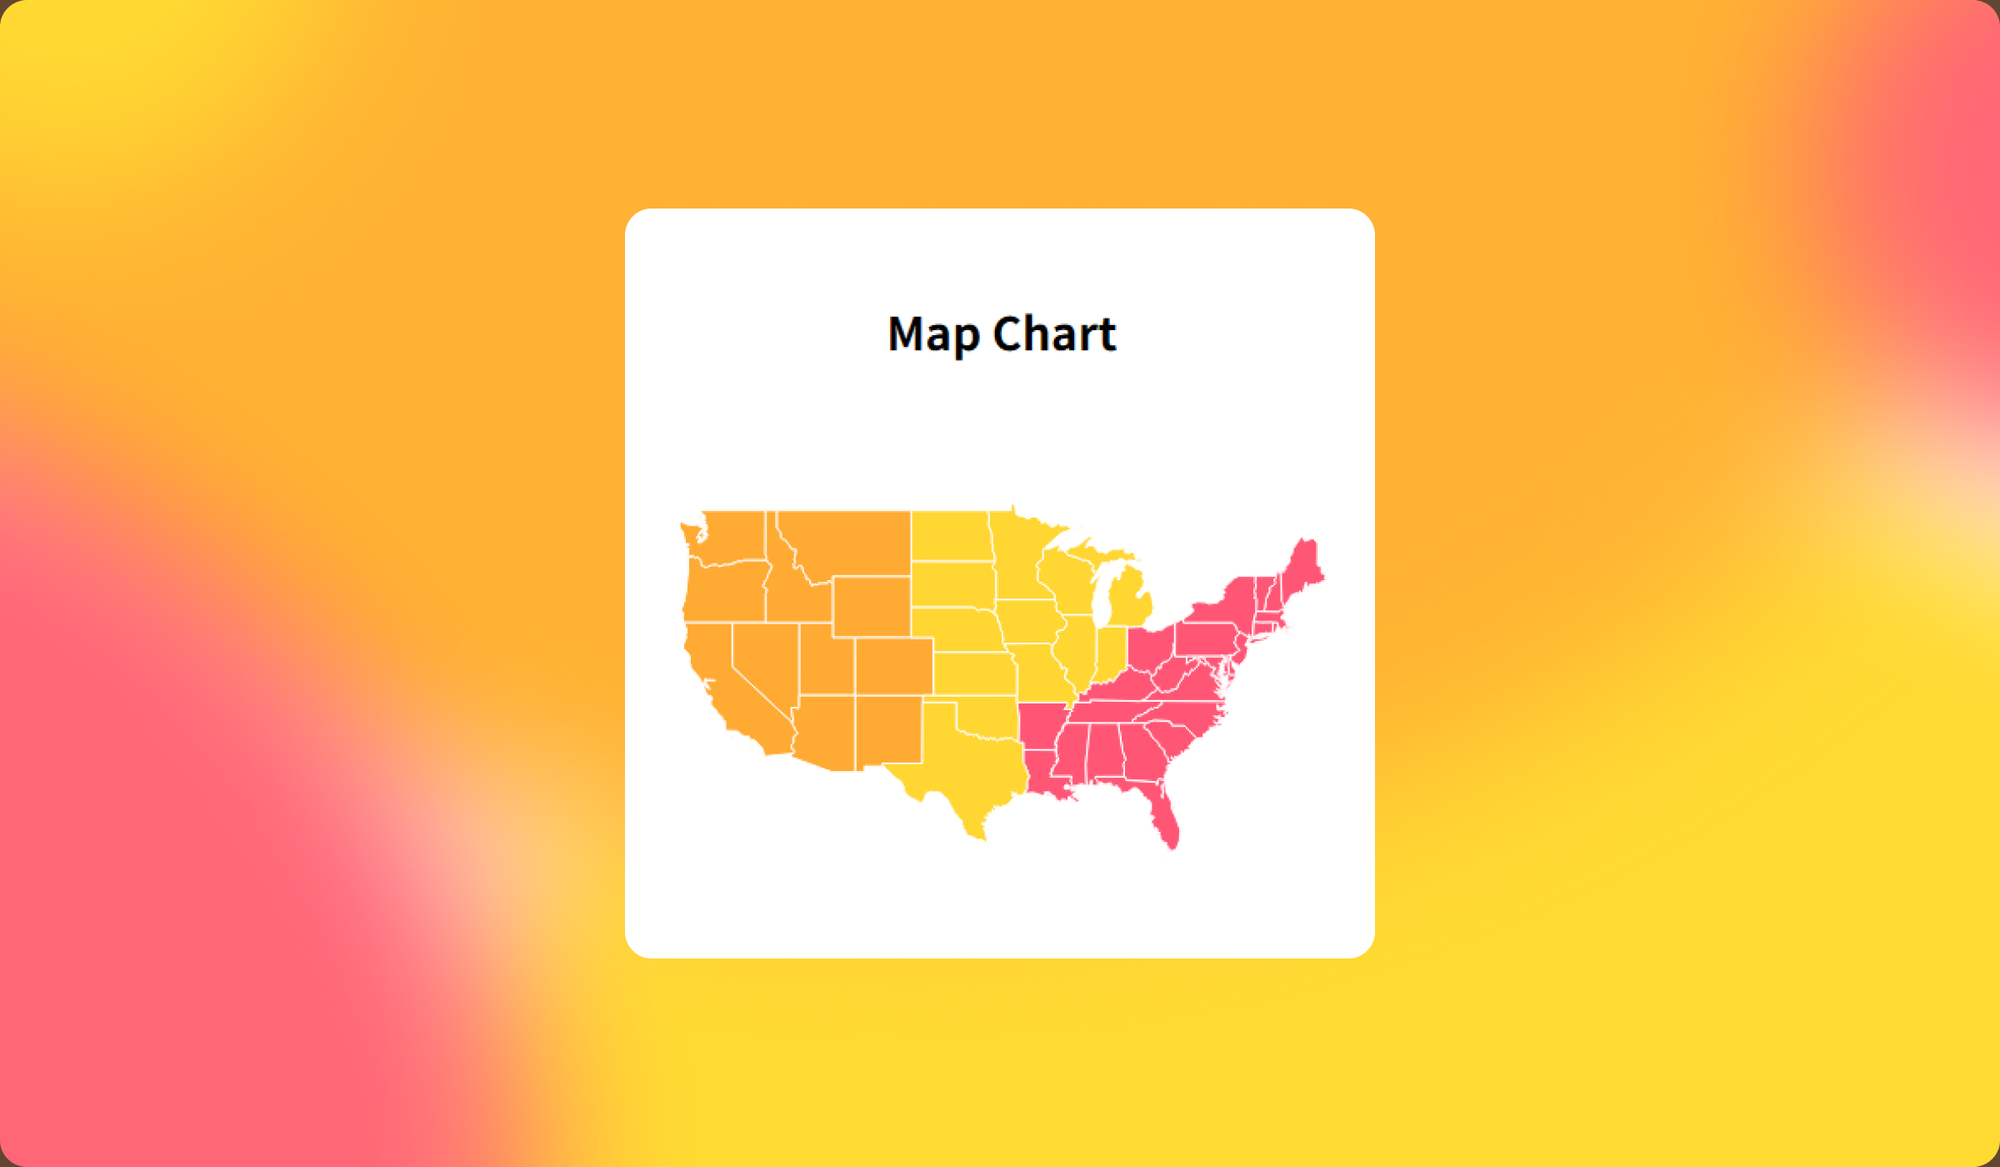
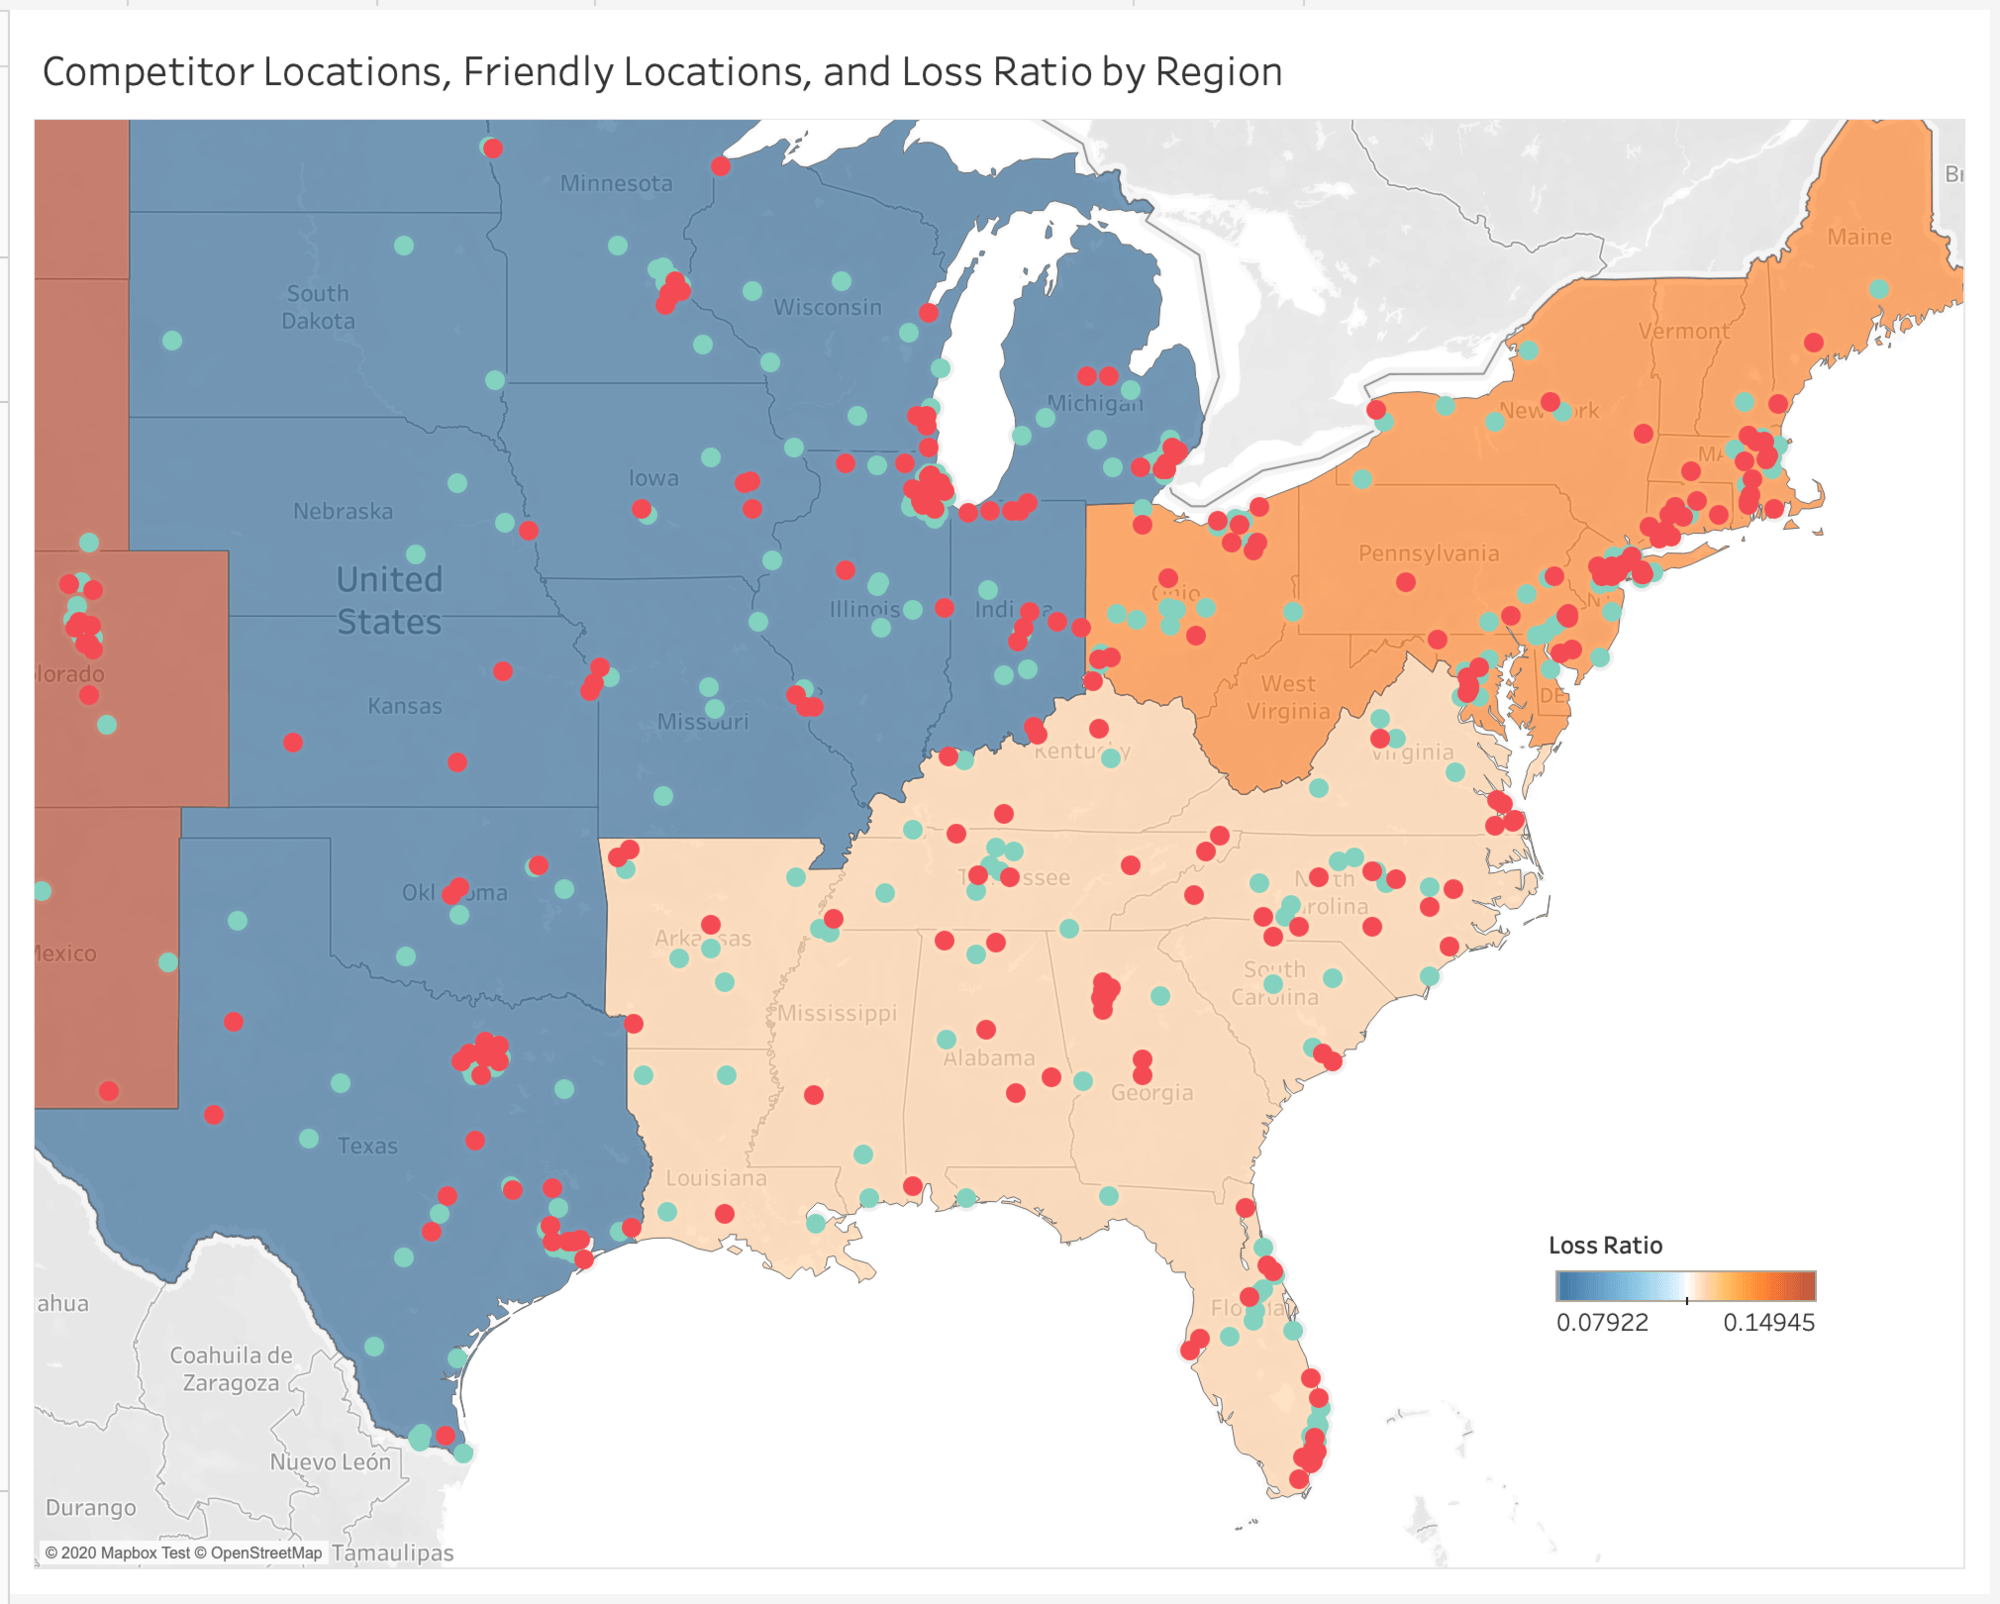
- Map: When fields have
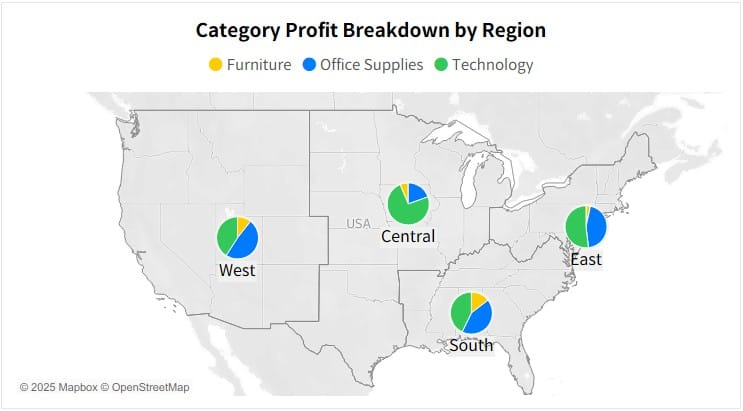
Geographic Role, areas can be displayed in their actual shapes, with measures applied as color. However, larger regions may appear overly emphasized, so use with caution. - Pie: Useful when the number of regions is small and evenly spaced so that marks do not overlap. This allows you to intuitively compare category values across regions.
- Density: Best for visualizing clusters of data in densely populated areas. It highlights overall distribution rather than individual values.
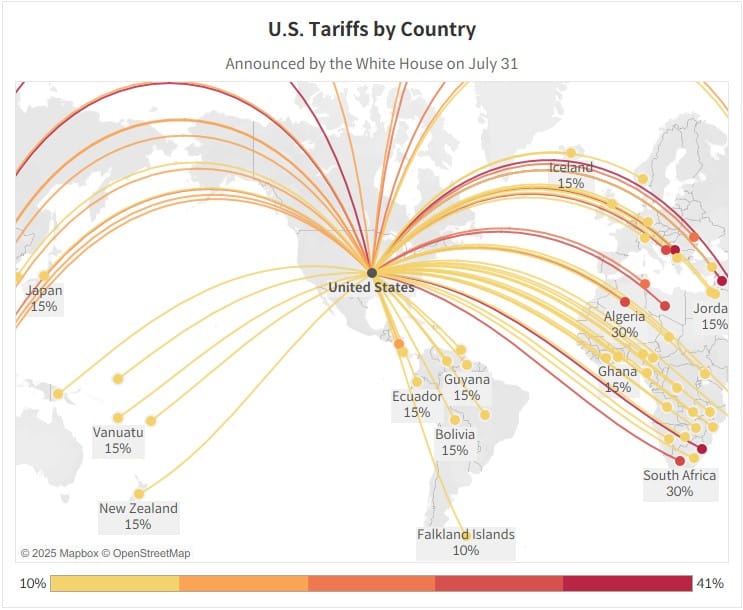
- Line: When your data includes both origin and destination coordinates, line marks can show flows between locations—ideal for analyzing movement across countries or regions.
Enhance Charts with Map Layers
Map charts also support map layers, which work similarly to dual-axis charts but allow multiple layers to be stacked. As maps zoom in, the visible area for data can shrink, so mixing marks such as circles, shapes, filled maps, or lines can improve readability.
Since map layers support more than two levels (unlike dual-axis), you can build richer and more detailed visualizations by layering multiple marks together.