Showing the Difference Between Two Points in a Tableau Line Chart

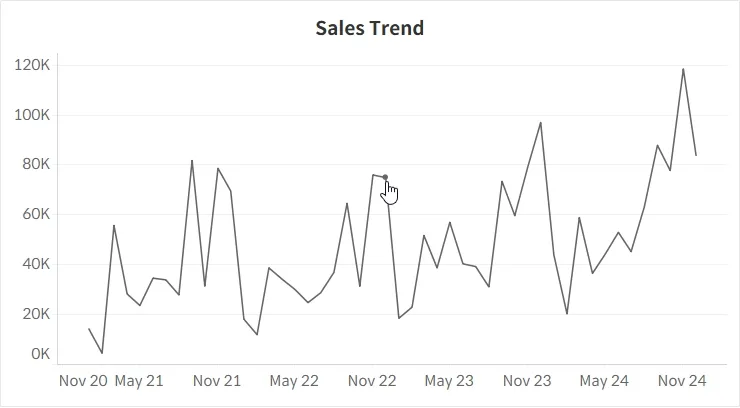
When working with a line chart, you may sometimes want to know the difference between two points. In such cases, you can use Tableau’s parameter actions to capture date values and apply them in conditional logic to display the rate of change directly on your dashboard.
In this example, the following features are implemented:
- The rate of change is displayed based on the more recent of the two selected points.
- The area between the two selected points is shaded.
- If one of the two selected points is clicked again, that selection is canceled.
- If a point outside the two selections is clicked, the previous selections are reset, leaving only the newly selected point.
Step-by-Step: Showing the Difference Between Two Points
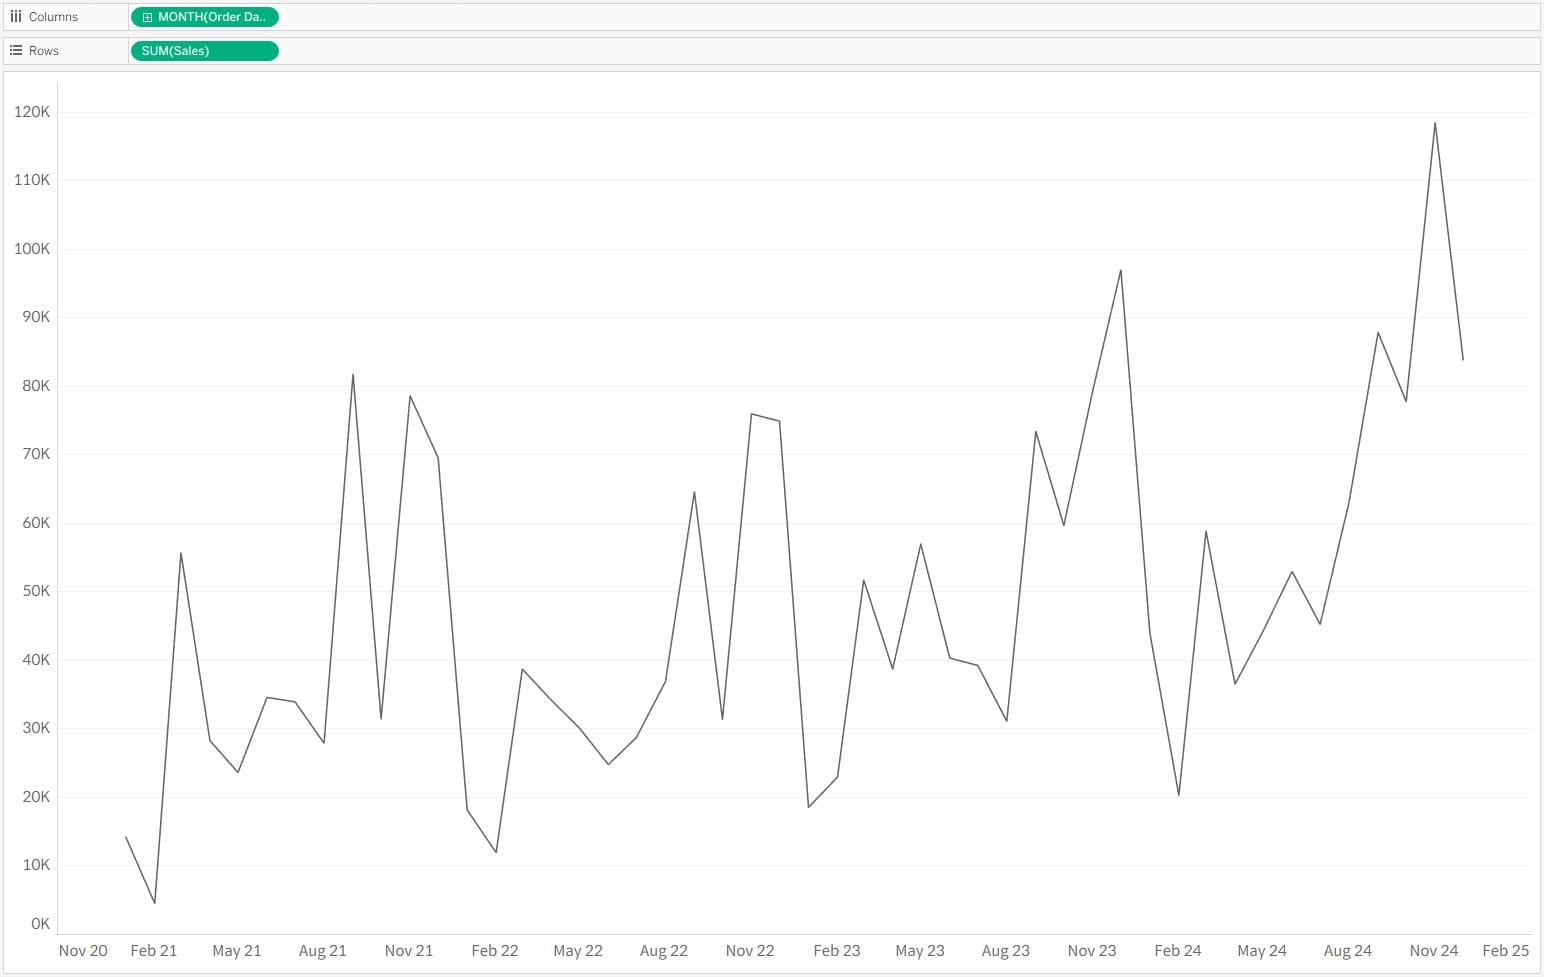
This example is built using a monthly sales line chart from the Superstore dataset.
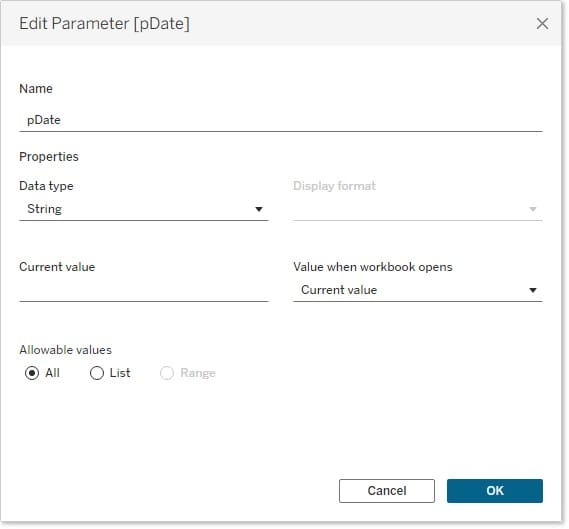
- Create a parameter to capture the selected date values. Since both points will be stored in a single parameter, create a string parameter.
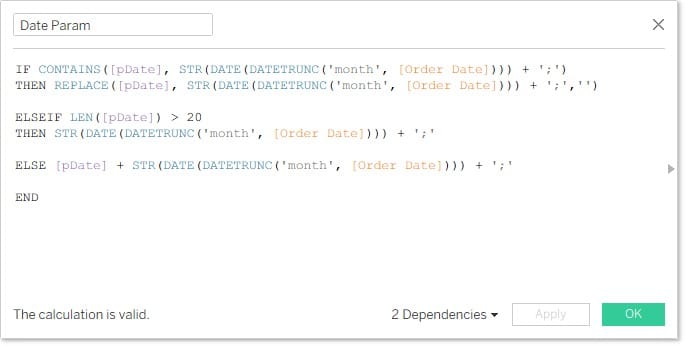
- Build a calculated field to pass values into the date parameter. Date values are separated with a semicolon (
;). The logic works as follows:IFthe same value is clicked, replace it with a blank.ELSEIFtwo date values already exist (longer than 20 characters), clear the old ones and insert the new value.ELSEappend the new value to the parameter string.
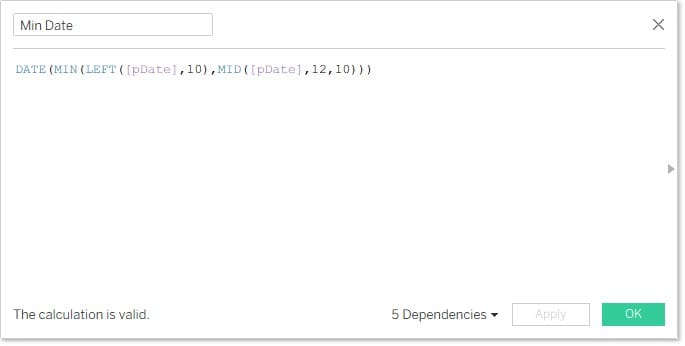
- Parse the two selected dates from the parameter into earlier (Min) and later (Max) values.

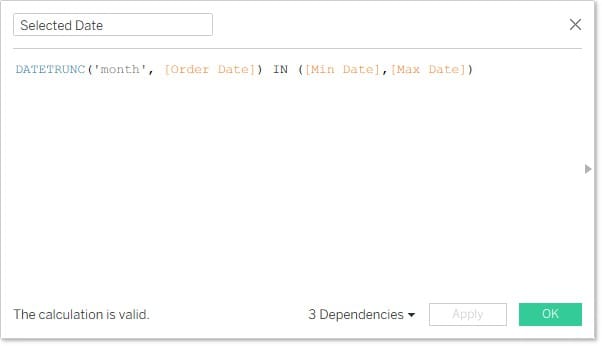
- Create a calculated field to return whether a point matches one of the two selected dates.
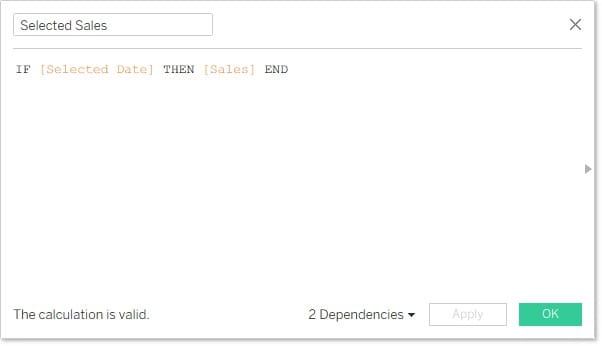
- Create a calculated field to return the sales values for the two selected dates.
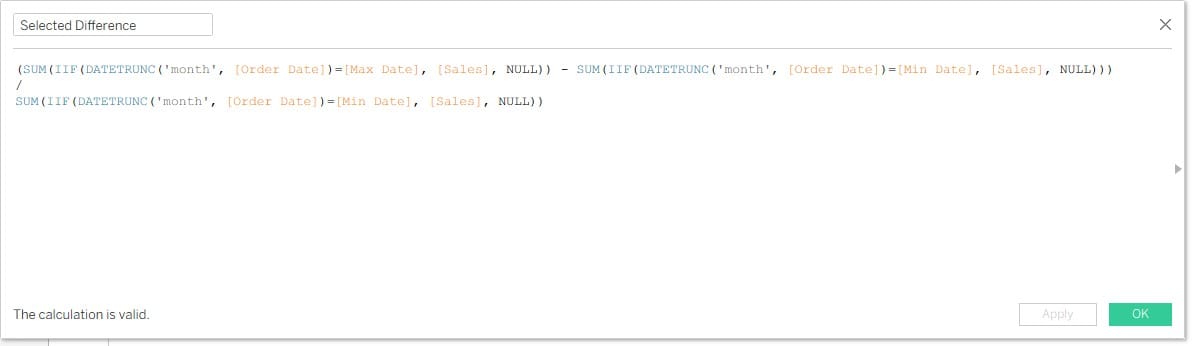
- Calculate the difference between the two selected sales values.
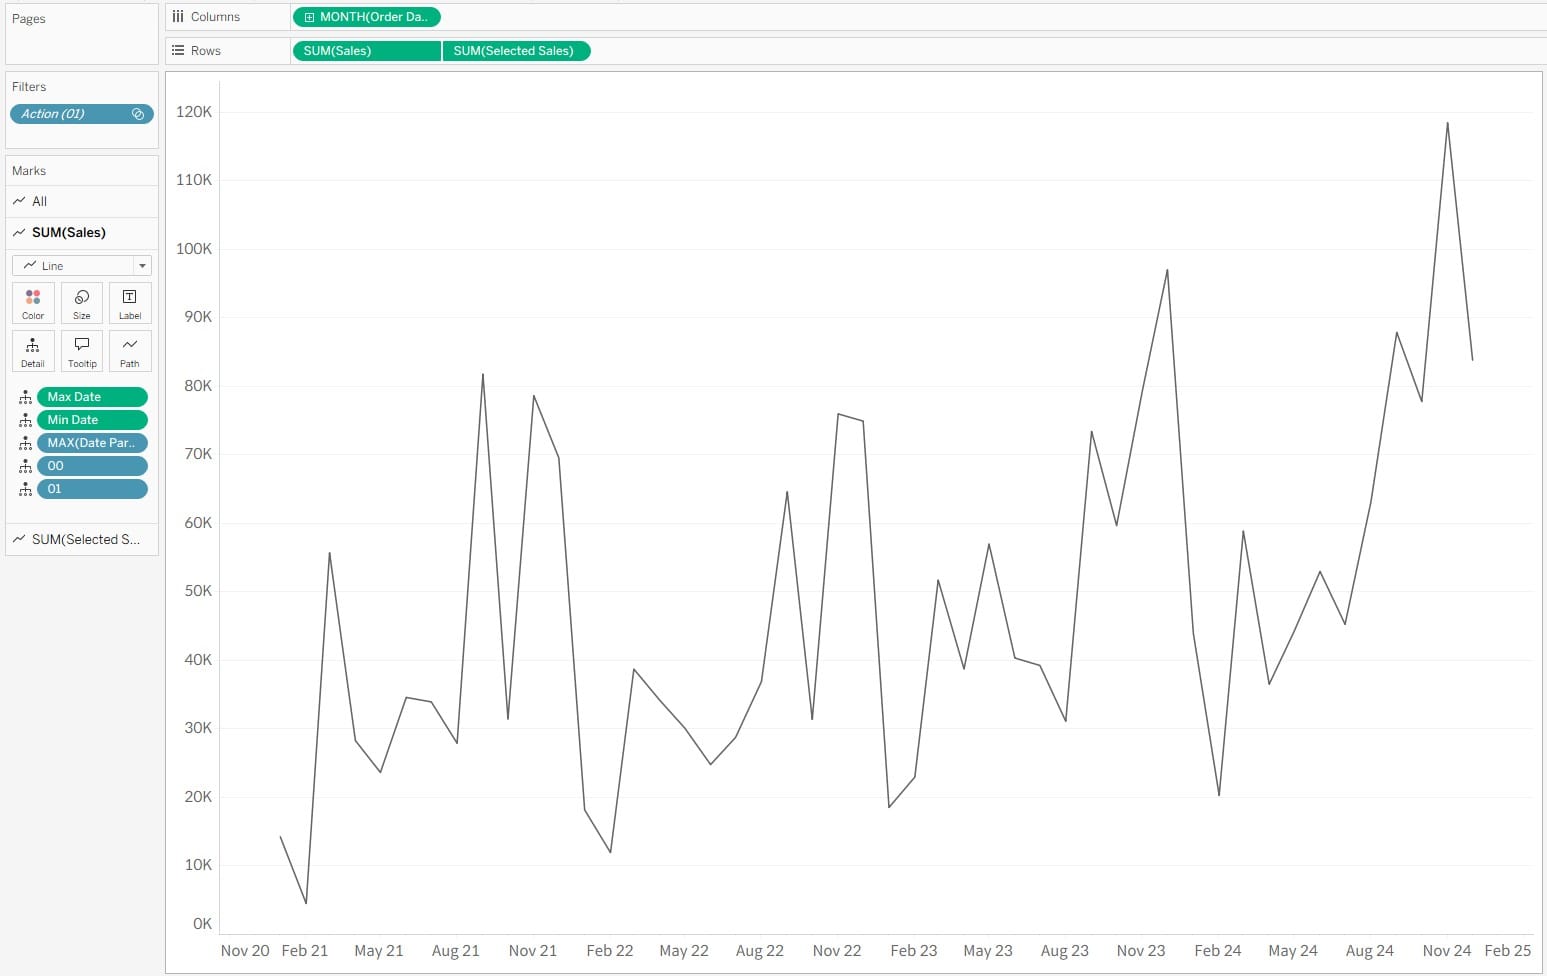
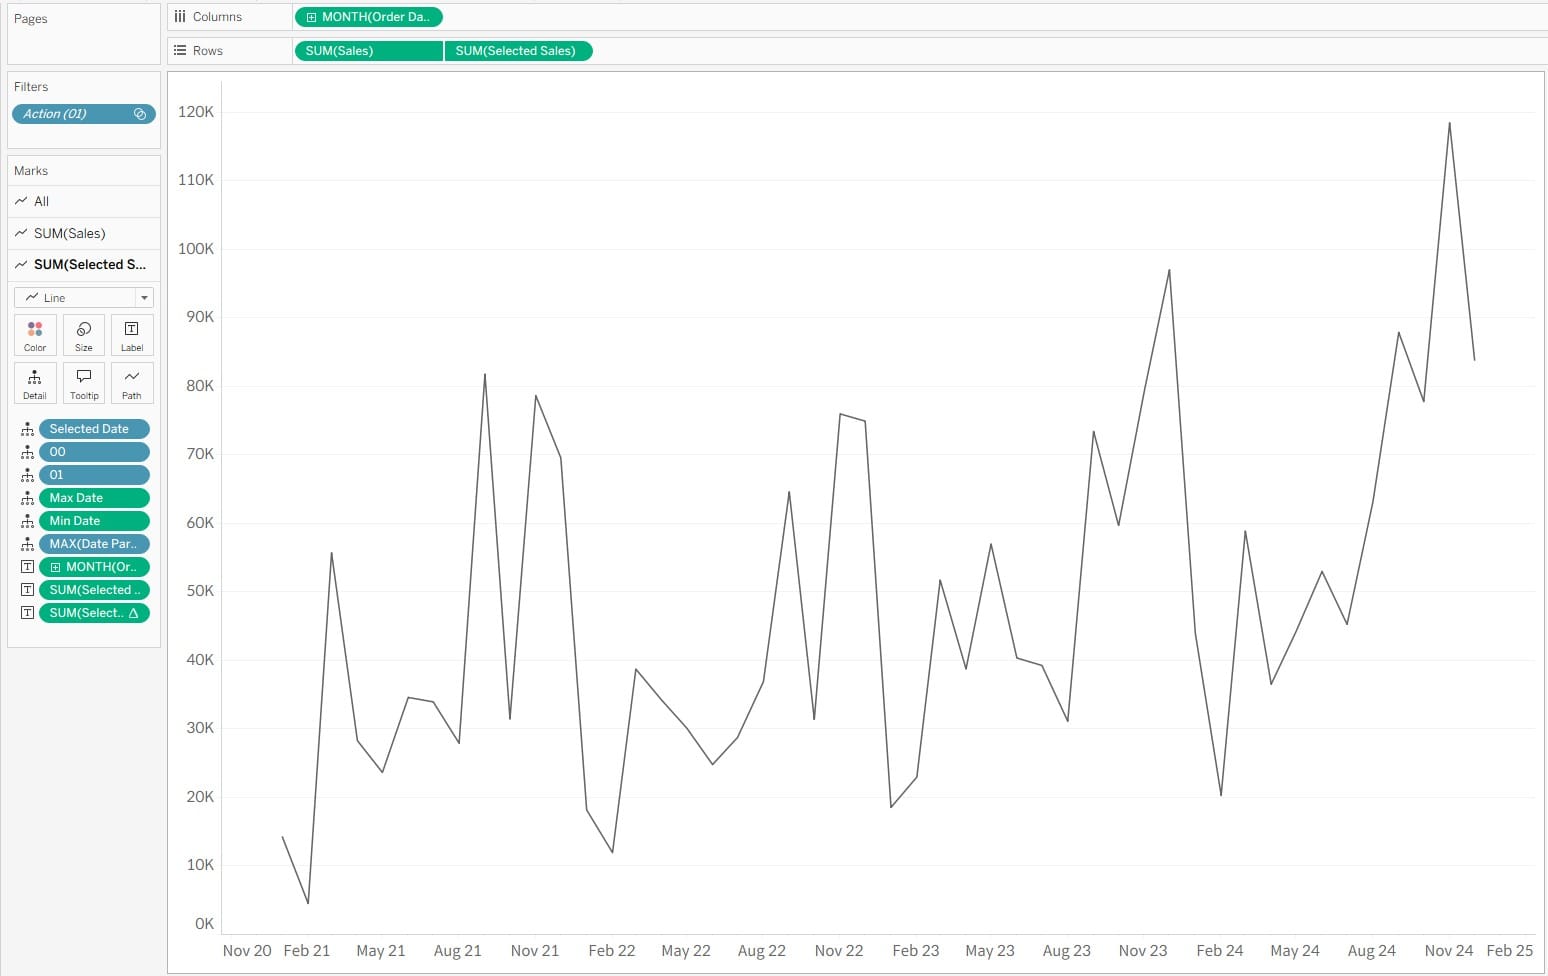
- Place the calculated fields onto the sheet. Use a dual axis with the original sales field and the selected sales field.
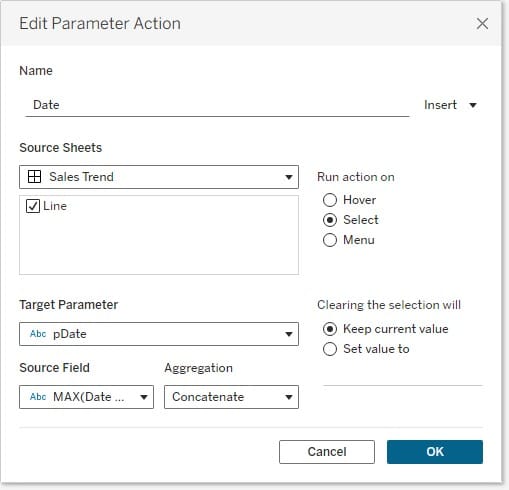
- Add a parameter action to pass date values into the parameter.
- Add a clearing action to remove highlight selections.
태블로에서 선택 영역 활성화 없애기
대시보드 동작을 위하여 특정 영역을 선택하였을 때, 파란색 음영으로 하이라이트 되는 것을 방지하는 방법입니다.
You can download the sample file below for more details. If you have questions while following along, feel free to leave a comment and I’ll be glad to help.