
How to Insert Images in Tableau Tooltips

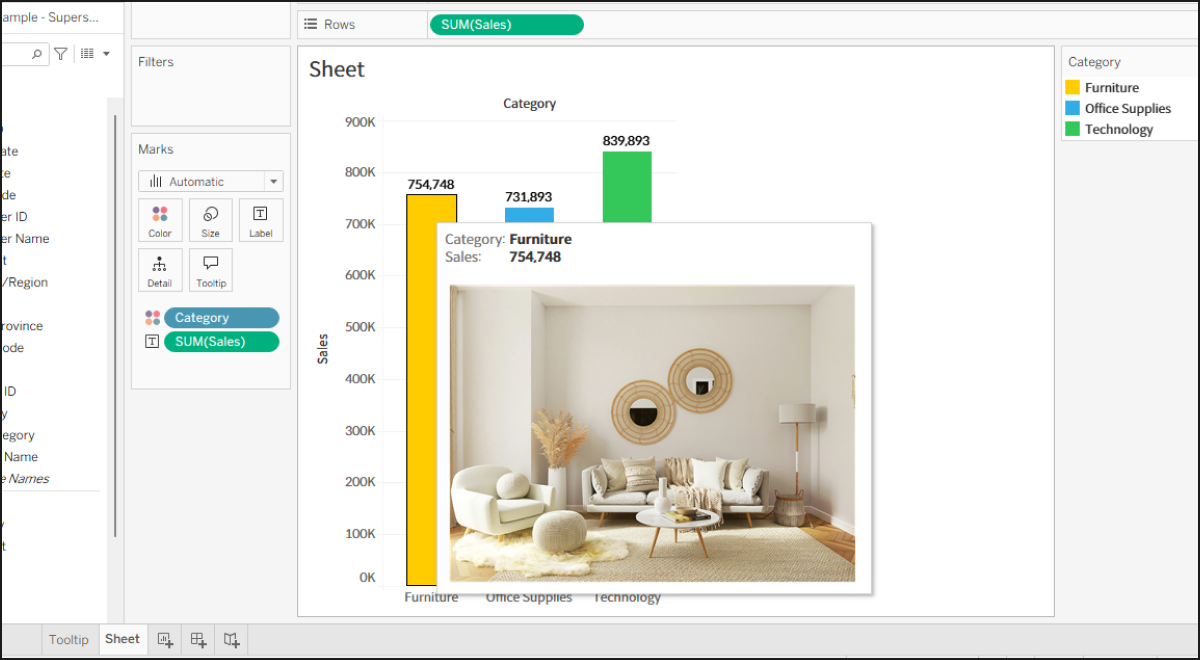
When designing Tableau dashboards, you might want to display a reference diagram, blueprint, or standard layout metric directly inside your hover tooltips. Adding a static image instead of a wall of text numbers significantly boosts dashboard readability and user comprehension.
💡
While many creators consider using the "Shapes" mark or the newer "Image Role" feature inside tooltips, they both introduce strict layout constraints. Shifting a Shapes mark into a tooltip causes severe image warping or stretching based on the pop-up box size. Meanwhile, Image Role works entirely via web URLs and enforces a rigid file threshold of under 200KB per file, making it unsuitable for crisp high-resolution images.
To insert an image without risking resolution loss or aspect ratio distortions, the cleanest approach is utilizing the Background Images platform located under the top [Map] menu.
Step-by-Step: Insert Images in Tooltips
- Because this feature natively reverse-engineers a spatial map pipeline to anchor graphics, it demands a baseline X and Y metric structure. Even if your production dataset lacks coordinate entries, you can easily bypass this step. Simply open your calculated fields card and type
0to build two blank dummy placeholder measures:[X]and[Y].
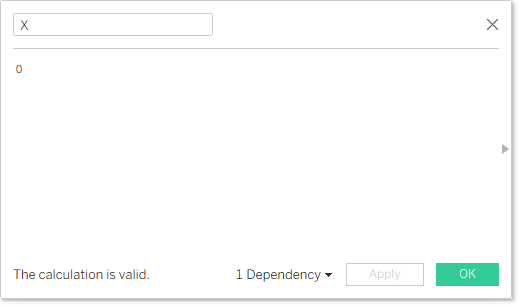
- Open a blank worksheet and drag your custom
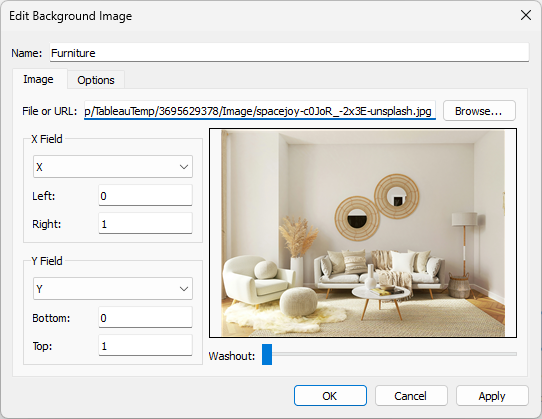
[X]pill onto Columns and[Y]onto Rows. To strip the view clear of default plot indicators, convert your Mark type dropdown to Polygon. - Now, go to the top menu bar, click [Map] > [Background Images] , and select your active data asset. Click Add Image and select your high-res graphic file. Under the coordinate bounding parameters, link the X and Y properties to your calculated field anchors, and type the outer perimeter values strictly as Left: 0, Right: 1 / Bottom: 0, Top: 1. This binds your asset to fill the entire virtual 0-to-1 space.
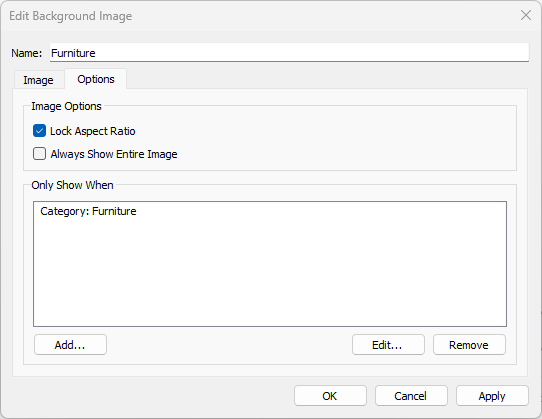
- (Optional) While navigating to the [Options] tab allows you to map specific category flags to filter target graphics—effectively enabling 'Dynamic Images'—manually looping every single product item within a massive dataset degrades development efficiency. This approach is highly recommended for displaying single, locked reference charts rather than multi-tiered product arrays.
- To finalize your image container, fix both worksheet axes to an absolute scale of 0 to 1, and uncheck Show Header to hide gridlines. Head back into your primary analytical chart, open your [Tooltip] configuration panel, and select [Insert] > [Worksheets] to anchor your image container sheet.
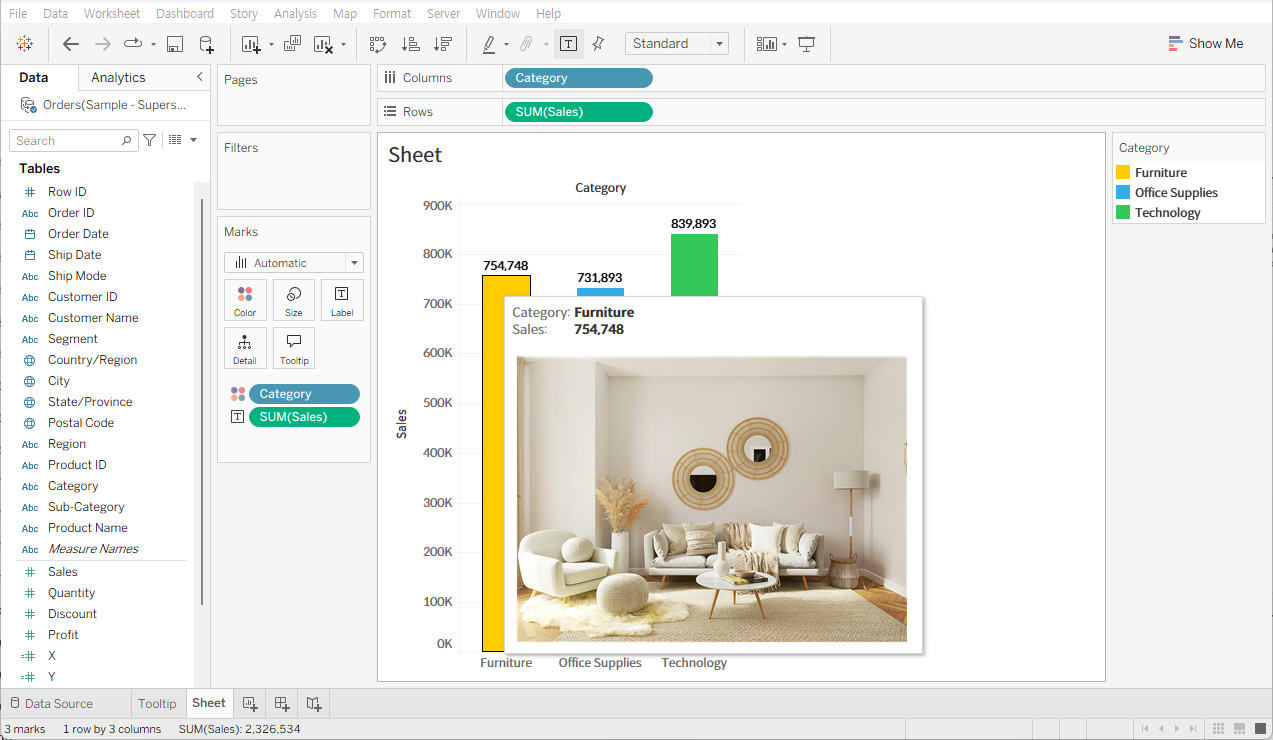
Once loaded, fine-tune the auto-populated maxwidth and maxheight parameters to match the true aspect ratio of your original image asset, ensuring a perfectly aligned, unpixelated graphic layout.