Using Date Parameter in Tableau
This article covers key points to keep in mind when working with date parameters in Tableau, especially given the wide variety of user needs.


When building dashboards that connect to a database, it's common to use date parameters as filters so users can explore the data across different timeframes. However, users often want to view data by day, week, month, or even within a custom range—making it difficult to create a single solution that works for everyone.
In this post, I’ll go over some important considerations based on real-world experience when setting up date parameters.
Keep the Date Updated to the Most Recent
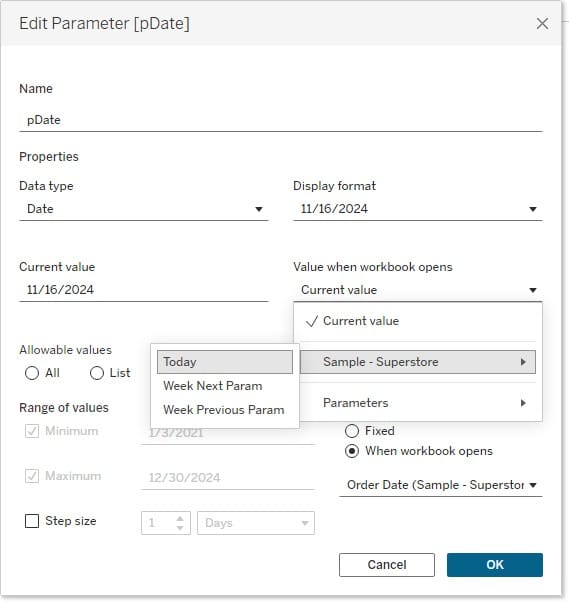
It might seem obvious, but users are almost always interested in the most recent data. If your data updates at irregular intervals, it can be hard to automate. Still, it's helpful to identify when your database is reliably updated and make sure the date parameter points to that time.
When using the MAX function to get the latest date, it might not behave as expected. That’s because aggregate functions like MAX can return different results depending on the dimensions in the view. To avoid this issue, wrap your calculation in a FIXED expression.
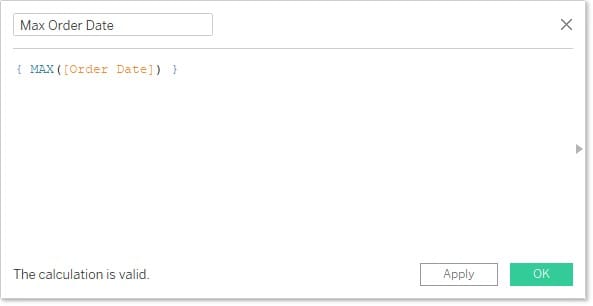
FIXED keyword and just use curly braces {} to get the same effect.Sort Dates in Descending Order
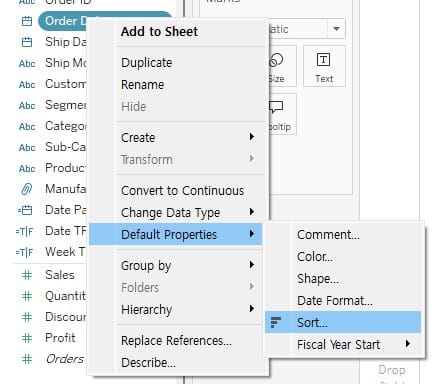
To improve usability, especially when showing recent data, make sure the date values in your parameter list appear in descending order (most recent first).
You can do this by adjusting the sort order in the original date field used by the parameter.
Be Careful with From-To Date Filters
Sometimes, to give users the most flexibility, dashboards are designed with a From-To date range so users can select any period they want. While this can be powerful, there are a few things to watch out for as a developer:
- Year-over-Year (YoY) and Month-over-Month (MoM) comparisons may not work correctly. For example, if a user selects a range longer than a year, calculating YoY values could result in errors.
- It's harder to manage the x-axis on trend charts. Users often expect daily trends for short periods and monthly trends for longer periods. However, Tableau doesn’t automatically adjust the time granularity based on the selected range, which can make the charts harder to read or interpret.
Notes on Using Year/Month/Day Toggle Buttons
To support different user preferences, some dashboards include buttons to toggle between year, month, and day views. This setup typically takes a selected date and returns the corresponding year, month, or day value.
You’ll want to clarify:
- Should the chart show a cumulative total from the 1st to the selected date?
- Or should it show totals for the entire month or year that includes the selected date?
- Also, make sure to clearly indicate the data range being displayed.
Keep in mind, though: managing all these options in a single dashboard can get complicated quickly. The logic and calculations can become difficult to maintain. Instead, it’s often better to create and manage separate dashboards for yearly, monthly, and daily views.
Add a Calendar for More Intuitive Date Selection
If most users are selecting dates within a short period (like a month), adding a calendar UI can make the experience much smoother. A custom calendar can reduce the number of clicks compared to Tableau’s built-in date parameter selector. It also gives users a clear visual of the selected date, which helps them understand the data better.
For tips on how to build a custom calendar in Tableau, please refer to the post linked below.