
Chalk: A Dashboard Style with a Dark Sidebar and Pastel KPI Cards
A dashboard style that sets soft pastel KPI cards against a chalkboard-dark sidebar. Try the live sample built on fictional online-store orders.

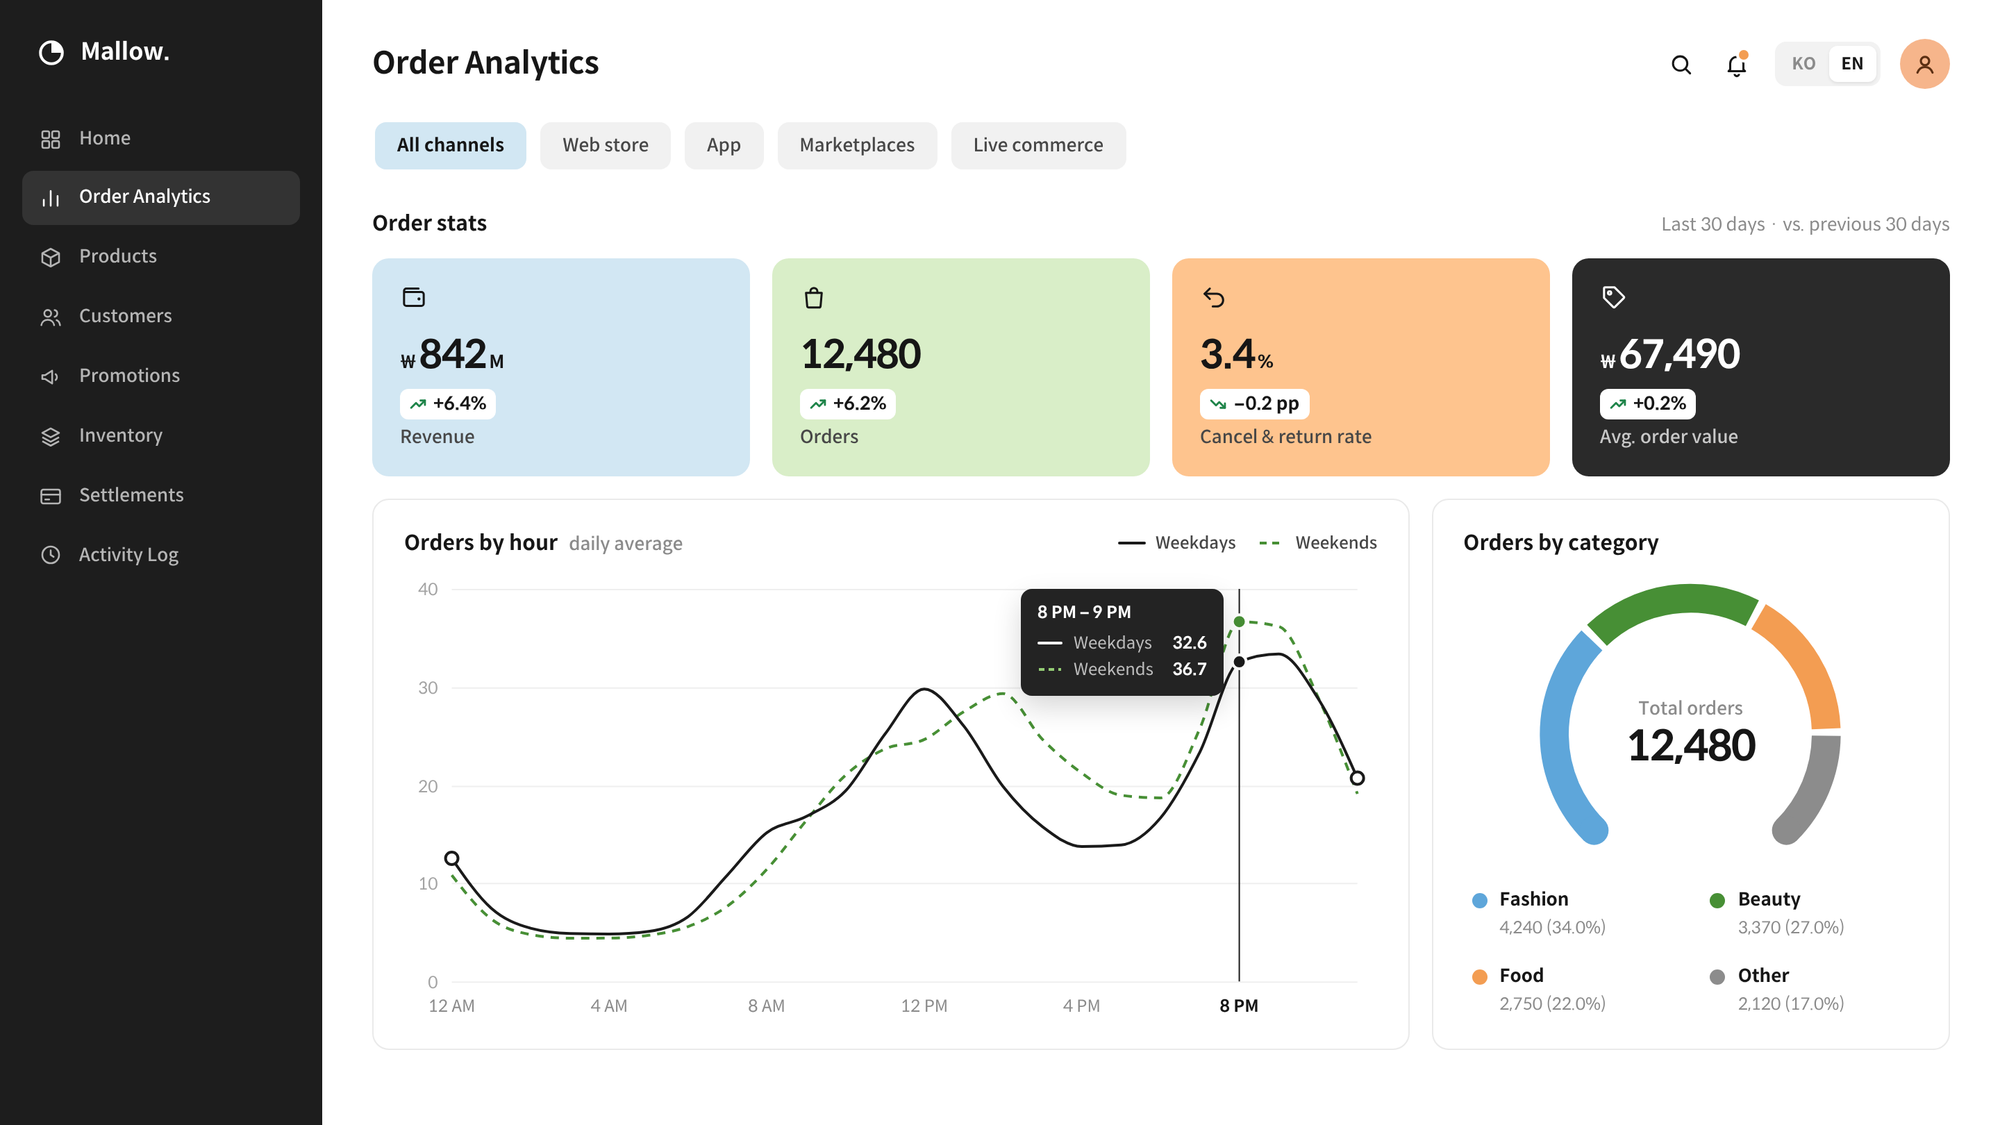
Chalk is a dashboard style that sets soft, chalk-pastel KPI cards against a chalkboard-dark sidebar. The sample below runs on 30 days of fictional online-store orders: switch the channel tabs and the KPIs and both charts update together. It is a single HTML file that runs in any modern browser.
Design
- Color stays in the tiles. Pastels fill the KPI tile backgrounds only; numbers and chart marks are darker, so the data reads first. The chart colors are checked to stay distinguishable for readers with color-vision deficiencies.
- Deltas are colored by meaning, not direction. An arrow turns green when the change is good. Cancel & return rate should fall, so its drop shows in green.
- Weekdays and weekends on one axis. Orders by hour overlays weekdays (solid) and weekends (dashed) to show where the peaks differ, with the focus starting on the busiest hour. Choose Live commerce to see orders cluster around broadcast hours.
- Three category colors at most. Category share uses a gauge donut with up to three hues; everything else folds into a gray “Other.”
Prompt
Chalk’s layout, colors, type, cards and chart treatments are documented in the style spec. Include the link in your request to get the same style on your own data.
Build a single-file HTML dashboard from the attached data in the Chalk style.
Follow the layout, colors, type, cards and chart treatments in this spec,
and choose the metrics and charts that fit the data.
https://styles.vizney.com/chalk/style.html
Need a dashboard built in this style? Get in touch.