What is Scrollytelling?


In the world of data visualization, going beyond simply displaying data to delivering a clear message and immersing the reader is a significant challenge. Today, let’s talk about one of the most effective data storytelling techniques: Scrollytelling.
Defining Scrollytelling
Scrollytelling is a portmanteau of 'Scroll' and 'Storytelling.' It refers to an interactive storytelling technique where the narrative unfolds as the user scrolls down a web page.
Unlike typical web pages or static dashboards that present all information at once for the user to explore independently, scrollytelling dynamically changes text, images, and graphs based on the speed and position of the user's scroll. This allows creators to guide the reader’s attention as intended and break down complex data into digestible steps.
Why Scrollytelling?
There are three main reasons why scrollytelling is gaining attention in data visualization:
- Increased Immersion: By requiring the user to actively scroll to interact with the content, it provides a much higher level of immersion compared to passively reading information.
- Reduced Cognitive Load: Presenting massive amounts of data at once can overwhelm the reader. Scrollytelling releases information sequentially, controlling the amount of information the reader needs to process at any given moment.
- Clear Narrative Structure: It is optimized for telling a data story with a beginning, middle, and end. It naturally guides the logical flow from the problem statement to the data analysis results and, finally, the conclusion.
Scrollytelling Examples
At Vizney, we consistently attempt to use scrollytelling techniques to effectively convey messages through data. Here are two examples we previously released as challenge pieces:
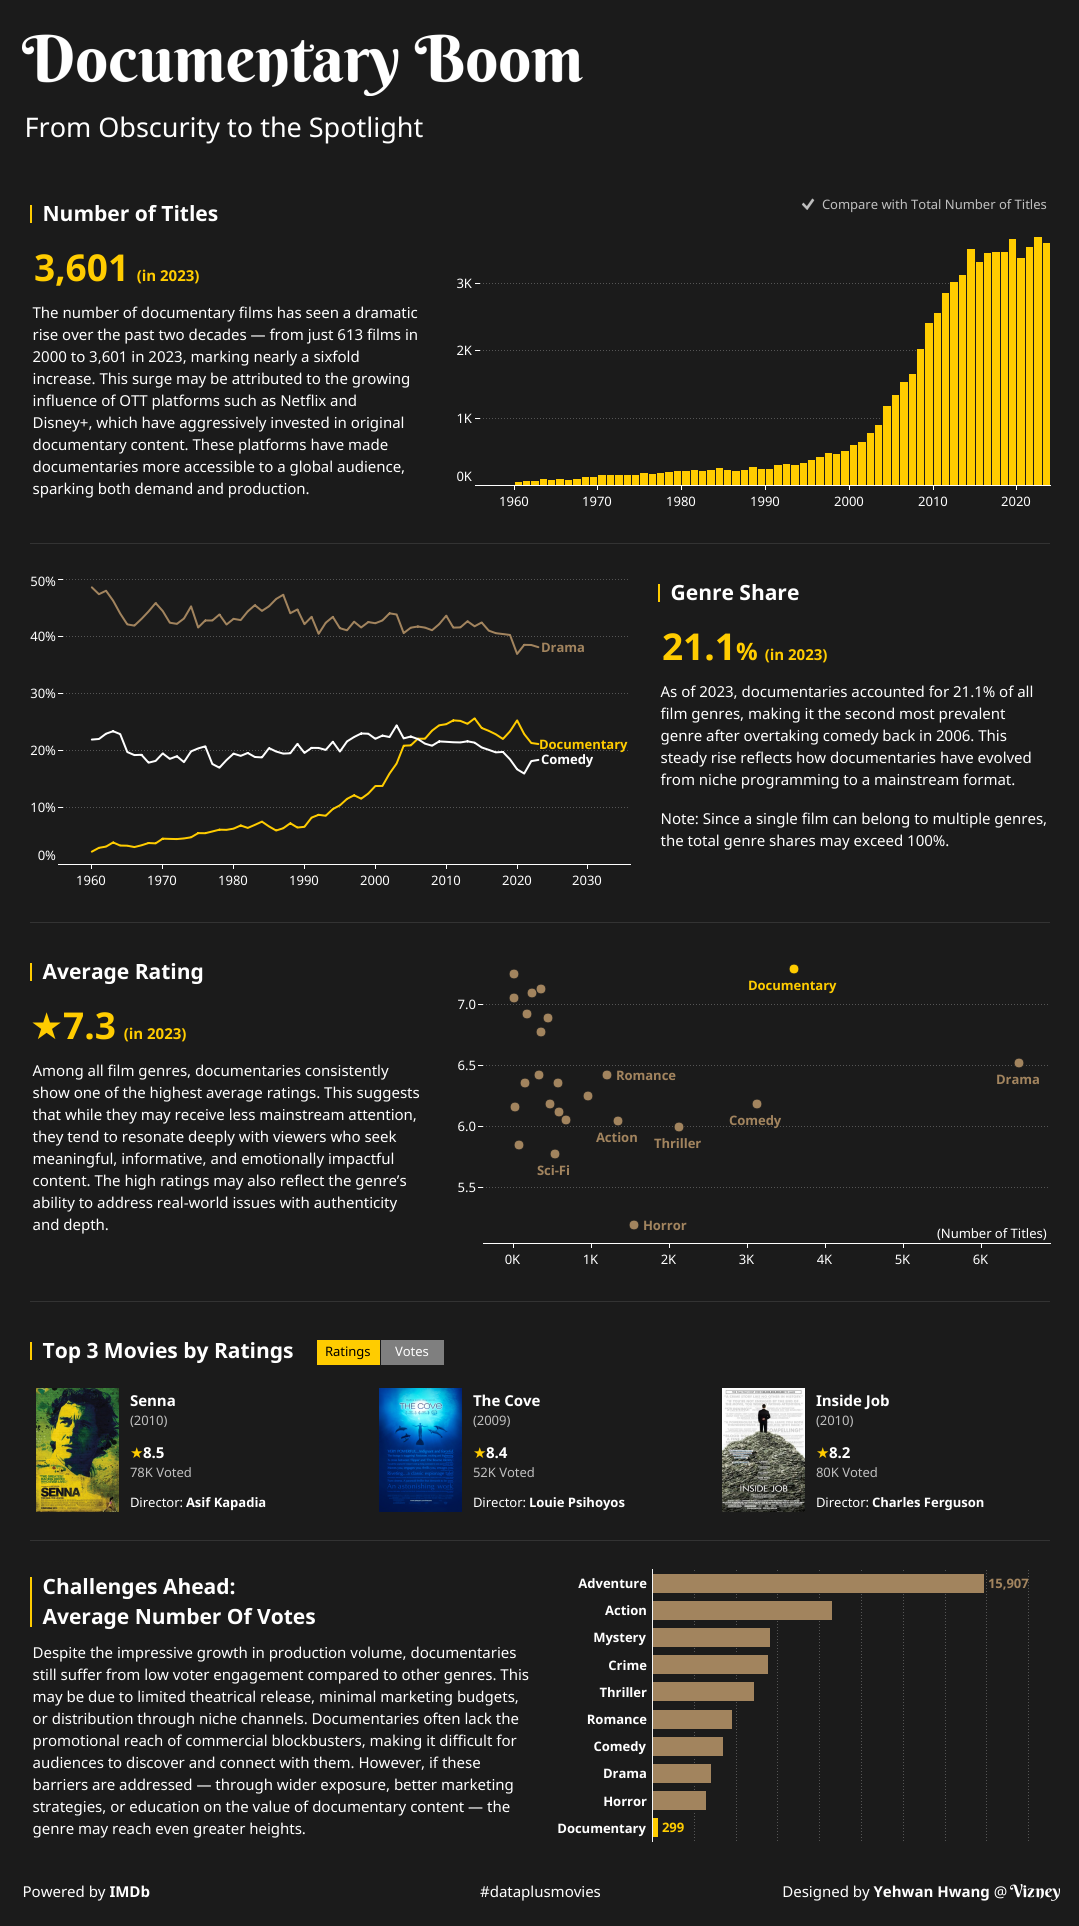
- Documentary Boom
This visualization analyzes how the documentary genre has gained popularity on OTT platforms like Netflix. As you scroll, it reveals the growth trends and popularity factors of the genre step-by-step, offering an experience akin to following the history of documentaries.
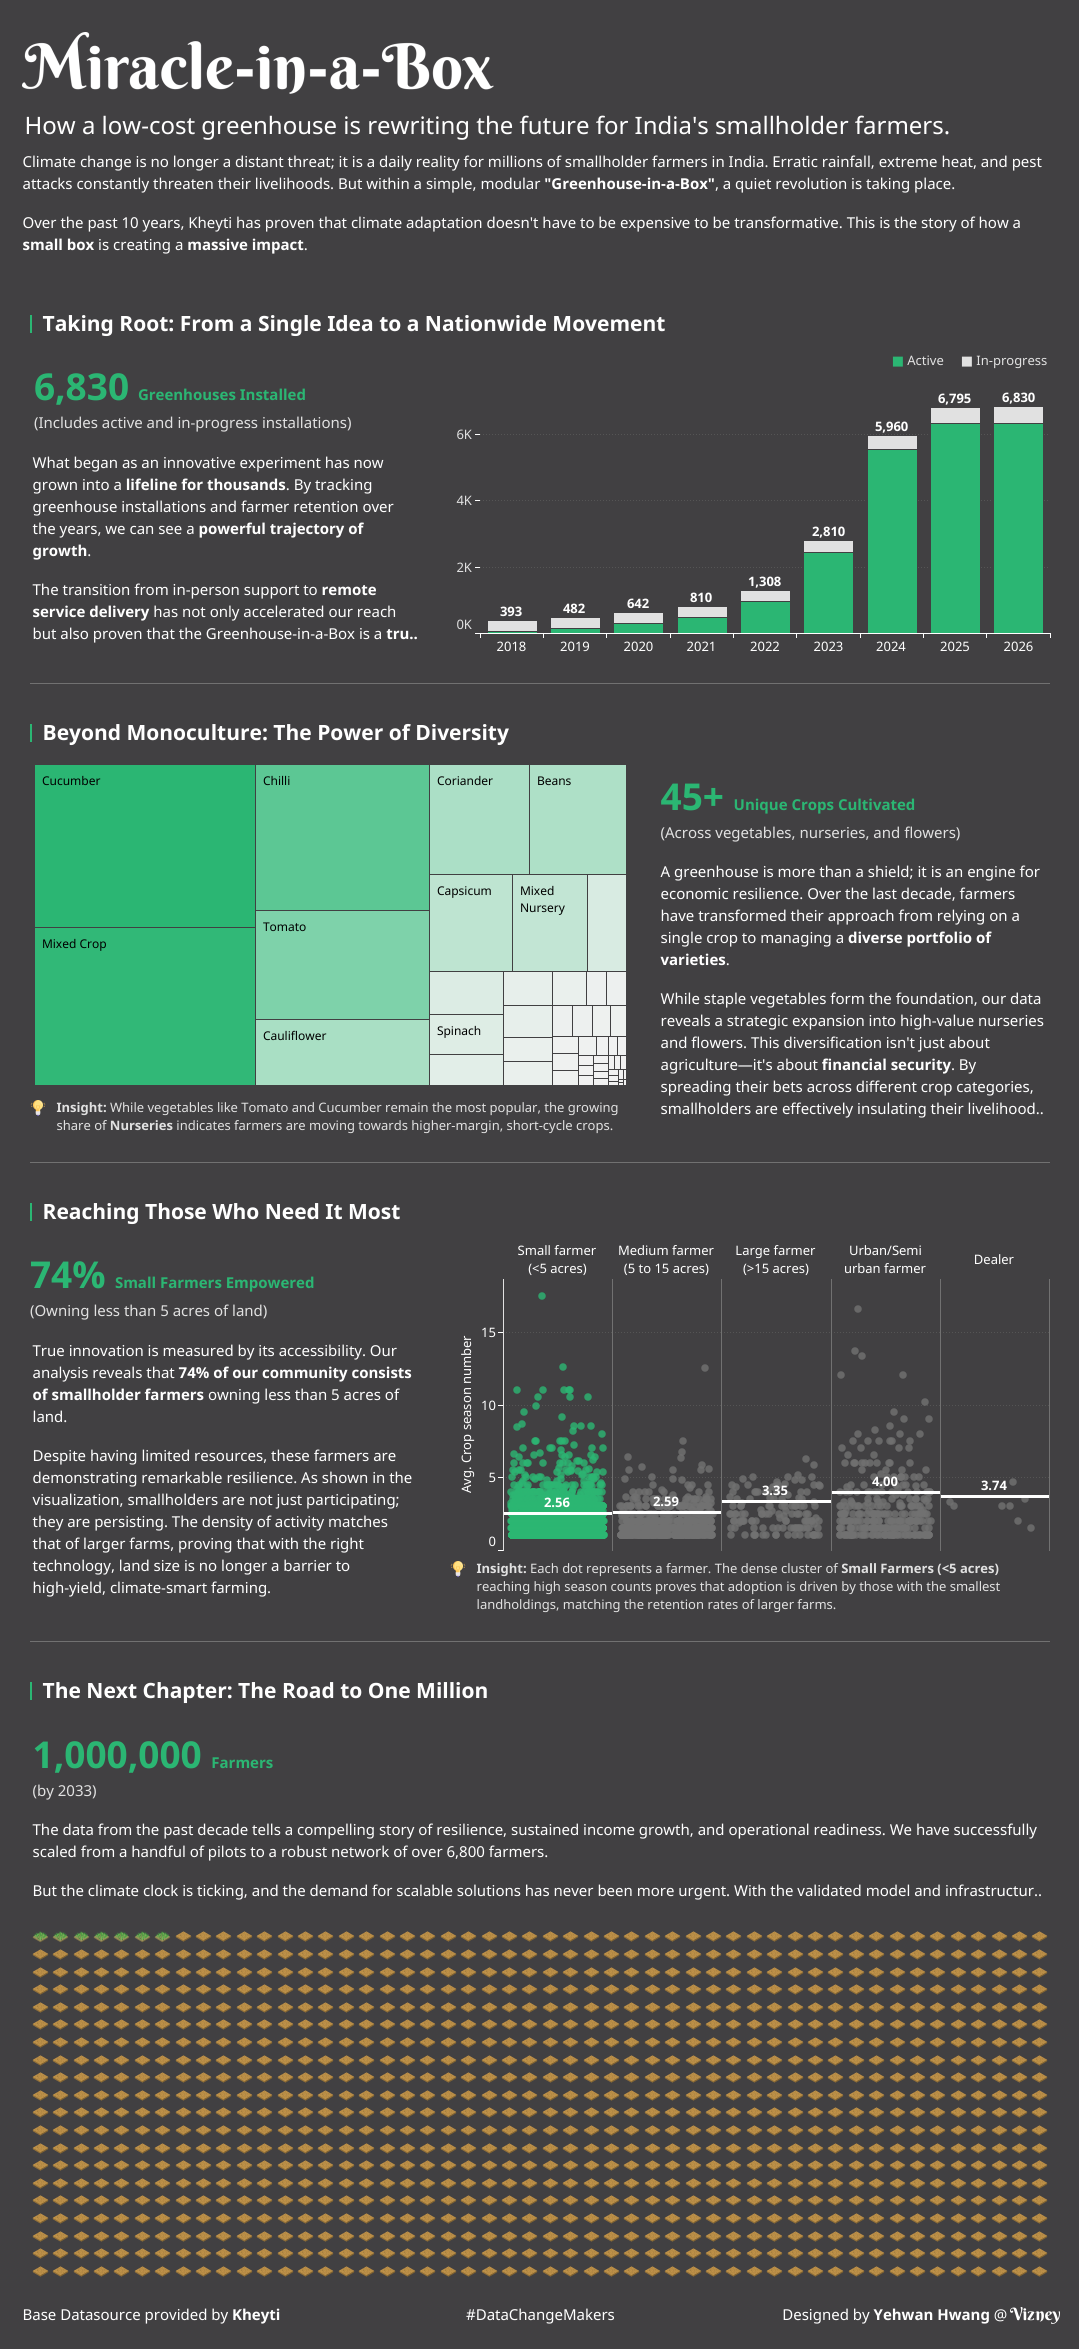
- Miracle in a Box
This dashboard covers how the greenhouse kits from the Indian agricultural innovation startup 'Kheyti' have changed farmers' lives. We utilized the scrolling flow to narrate the journey from the problem to the solution's impact, aiming to deliver the social value and emotion hidden behind the data.
Scrollytelling transforms data from simple 'information' into a memorable 'experience.' If you want your readers to follow the flow of your data without losing interest, scrollytelling is one of the most powerful tools available.
Vizney will continue to explore and research various ways to tell better stories through data.