
Why AI-Built Dashboards Look Right but Don't Get Used

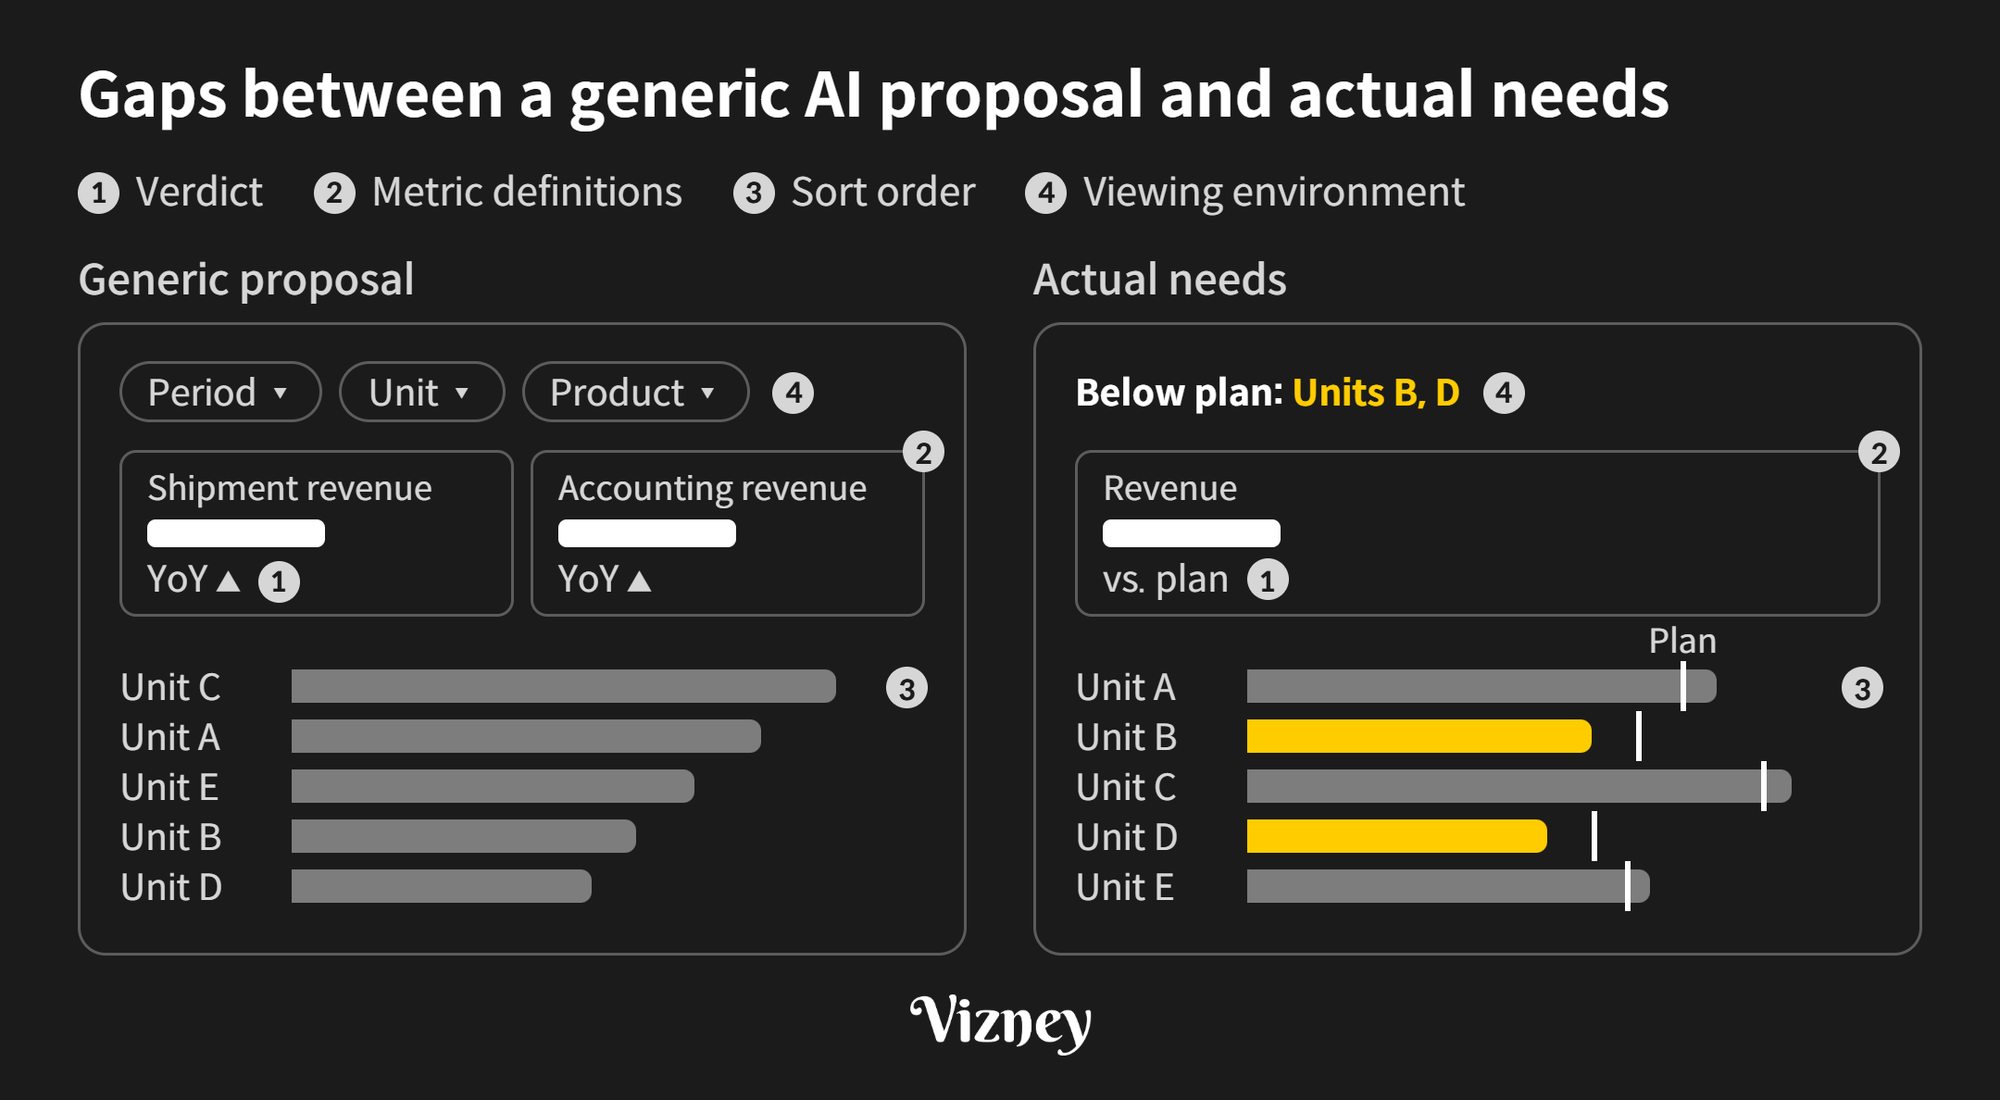
AI can produce a plausible dashboard in minutes, but rarely one that's usable in practice. That's not because AI can't build screens. It's because who looks at the screen, what they decide, and how performance is judged aren't in the data or the prompt. Settling those answers is dashboard planning, and it has to happen before you hand the screen to AI.
1. How do AI-built screens differ from what the business needs?
If you don't tell AI who the viewer is and what they decide, it infers the purpose from field names and data and builds a generally recommended screen. The screen isn't wrong, but it leaves gaps with the actual needs of each organization.
- Verdict: The generic proposal adds a year-over-year (YoY) change to every metric. If the company judges performance against plan, what's below plan has to show first, and if the plan was revised mid-year, someone has to decide which plan counts.
- Metric definitions: The generic proposal shows related metrics together. When two numbers share a name but not a definition, such as shipment revenue and accounting revenue, meetings tend to turn into reconciling numbers, so it's better to keep one official figure.
- Sort order: The generic proposal sorts by value. If performance reviews go business unit by business unit, a fixed order where each unit head can find their row right away beats a ranking that changes every month.
- Viewing environment: The generic proposal is an interactive screen with filters and drill-downs. If executives only see a screenshot in their inbox, anything behind a filter is invisible, so the verdict has to be reached on the first screen.
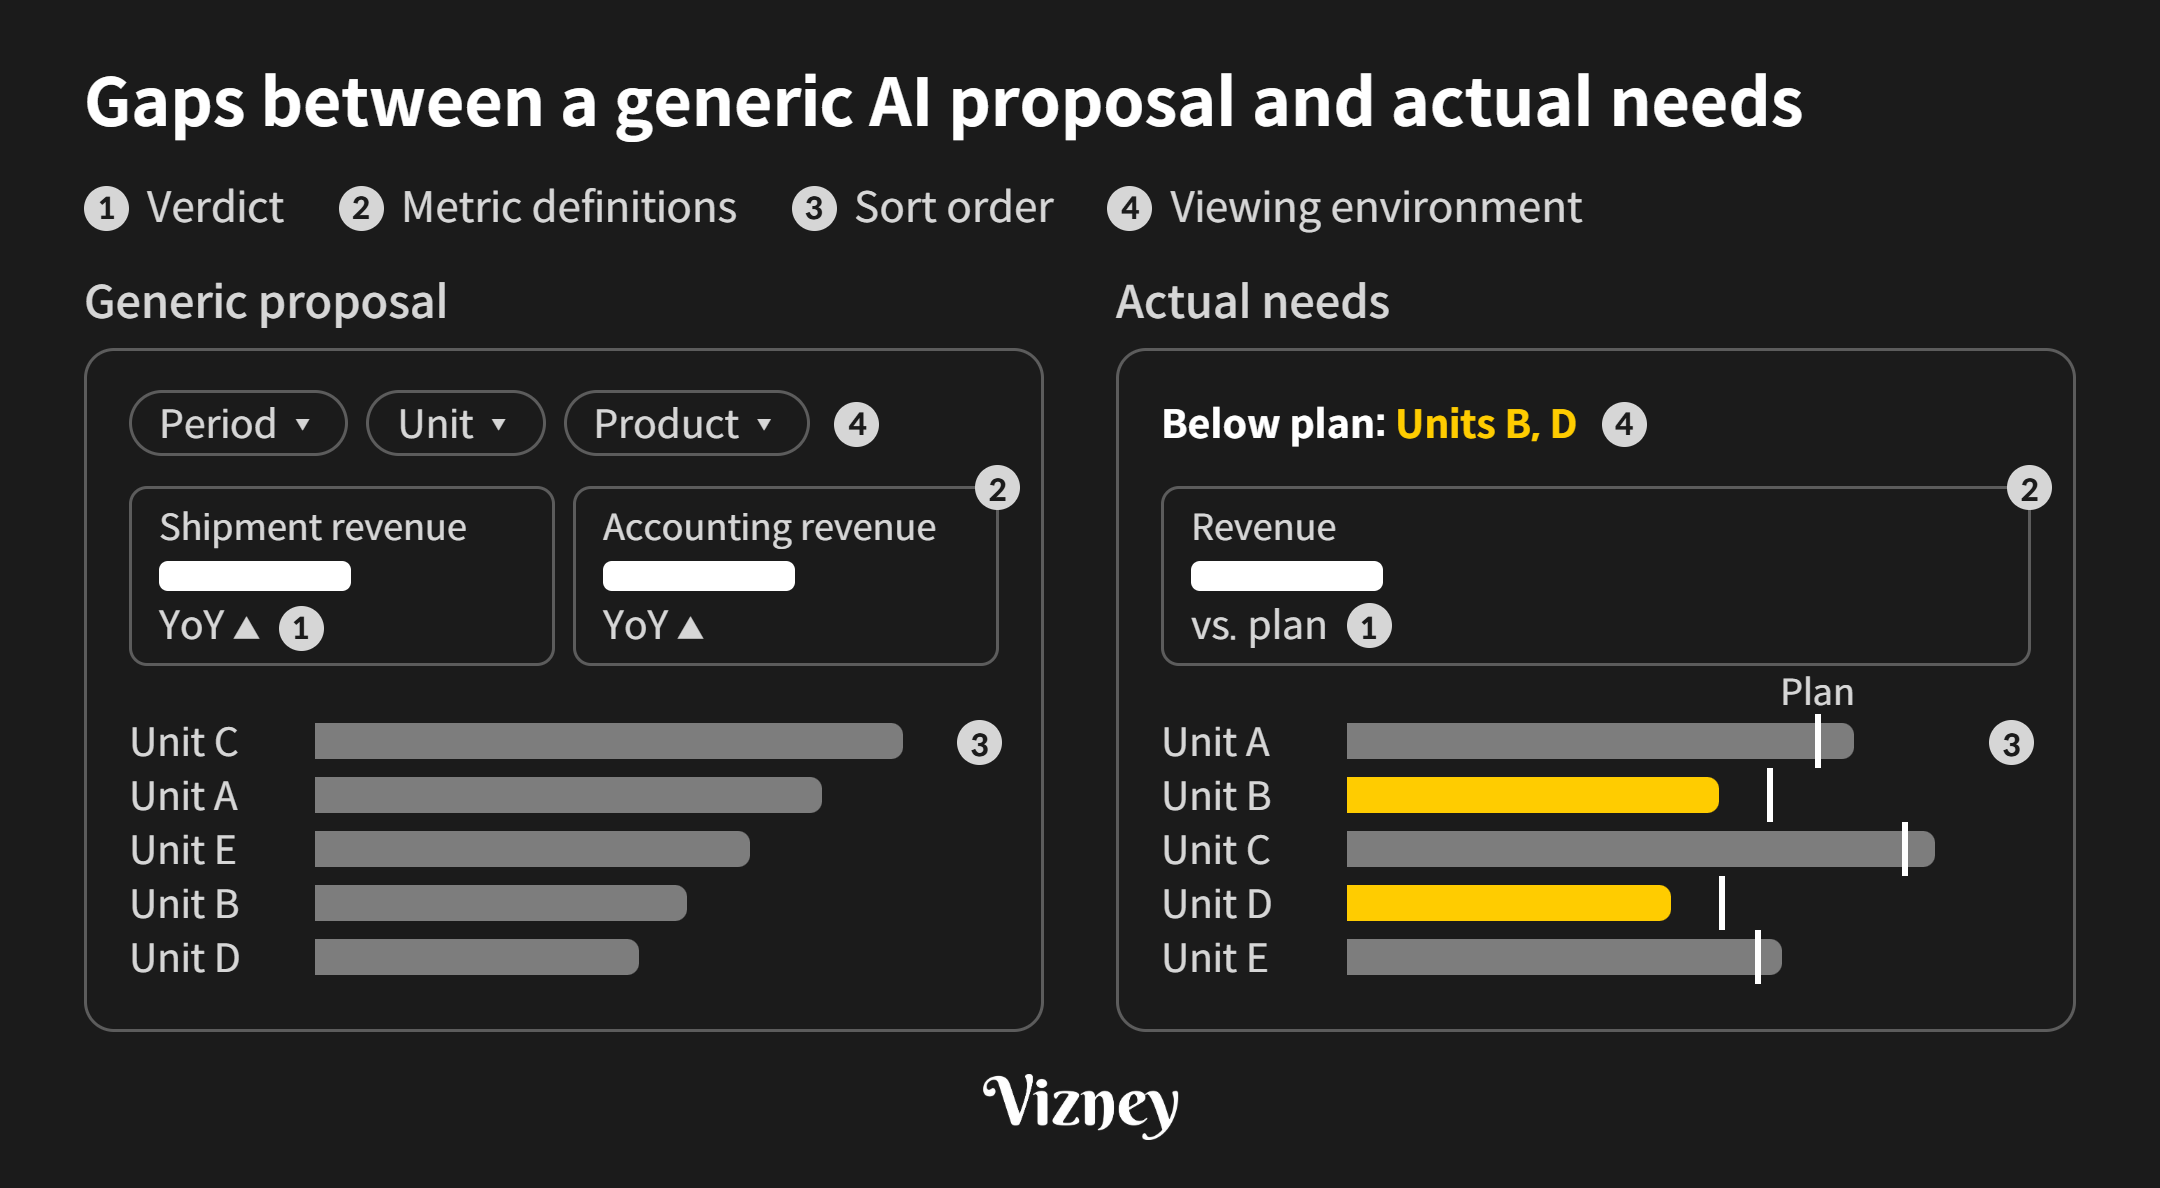
None of these answers are in the data. They come from asking the people who use the screen.
2. Does applying the company style fix it?
Not by itself. After building a dashboard style for a manufacturing company, we applied it to 15 existing dashboards with a single prompt. Colors, fonts, and number formats followed the same rules on all 15 screens, but the result wasn't usable in practice. Each screen served a different audience and decision, yet the same parts were dropped in with no hierarchy, so nothing showed what to look at first.
A style is the set of parts a company uses on every screen: colors, fonts, table and chart components, and number formats. Because it can be written down as rules, AI can apply it quickly, but what to show first is decided by planning, not by the parts.
3. If you tell AI what to show, does the screen come out right?
Not on its own. In November 2026, we ran a test with Vizney Blocks, a set of 37 copy-and-paste HTML dashboard cards. We wrote three requests: a monthly sales planning report, a Q3 P&L briefing for executives, and a weekly growth report. Each request listed what to show and came with data, but said nothing about who would decide what. Two kinds of AI agents built each request separately, for six outputs in total.
Drawing and data handling weren't the problem. All six changed only the data and left the card code alone. They compared October, still in progress, with the same days of September, and they caught a gap between the regional total and the overall total, reporting it as "needs review" instead of changing the values. What went wrong was choosing and arranging the charts.
- Donut with Other as 2nd-largest slice (4 of 6): Following the request for "a pie chart," the outputs put 6–8 items in the donut. The grouped "Other" became the second-largest slice, so the screen couldn't say which item ranked second.
- Five KPI cards in one row (2 of 6): All six built their own KPI row instead of using the set grid, and two squeezed five cards into one row.
- Daily headline clashes with weekly KPI (2 of 6): The headline number on the daily trend card showed the last day (Sunday), which conflicted with the weekly KPI on the same screen.
- 5-column table overflows at 390px (2 of 6): At phone width, the table ran off the screen sideways.
- Swapped to a different chart shape (2 of 6): When chart labels overlapped, the outputs dropped the chart that fit the question for a different shape.
Different models went wrong in the same places. The judgment about choosing and arranging wasn't in the data or the request.
So we wrote that judgment down. We added 11 lines of choosing-and-layout rules and a checklist to the skill, the instructions AI coding agents read, with a reason for each rule.
- When Other is bigger than the third slice: Switch to a bar chart and say why.
- Limits: Up to four KPI cards per row, and up to six rows per list.
- Design table first: Before choosing cards, show a "row · question · card" design table and the assumptions.
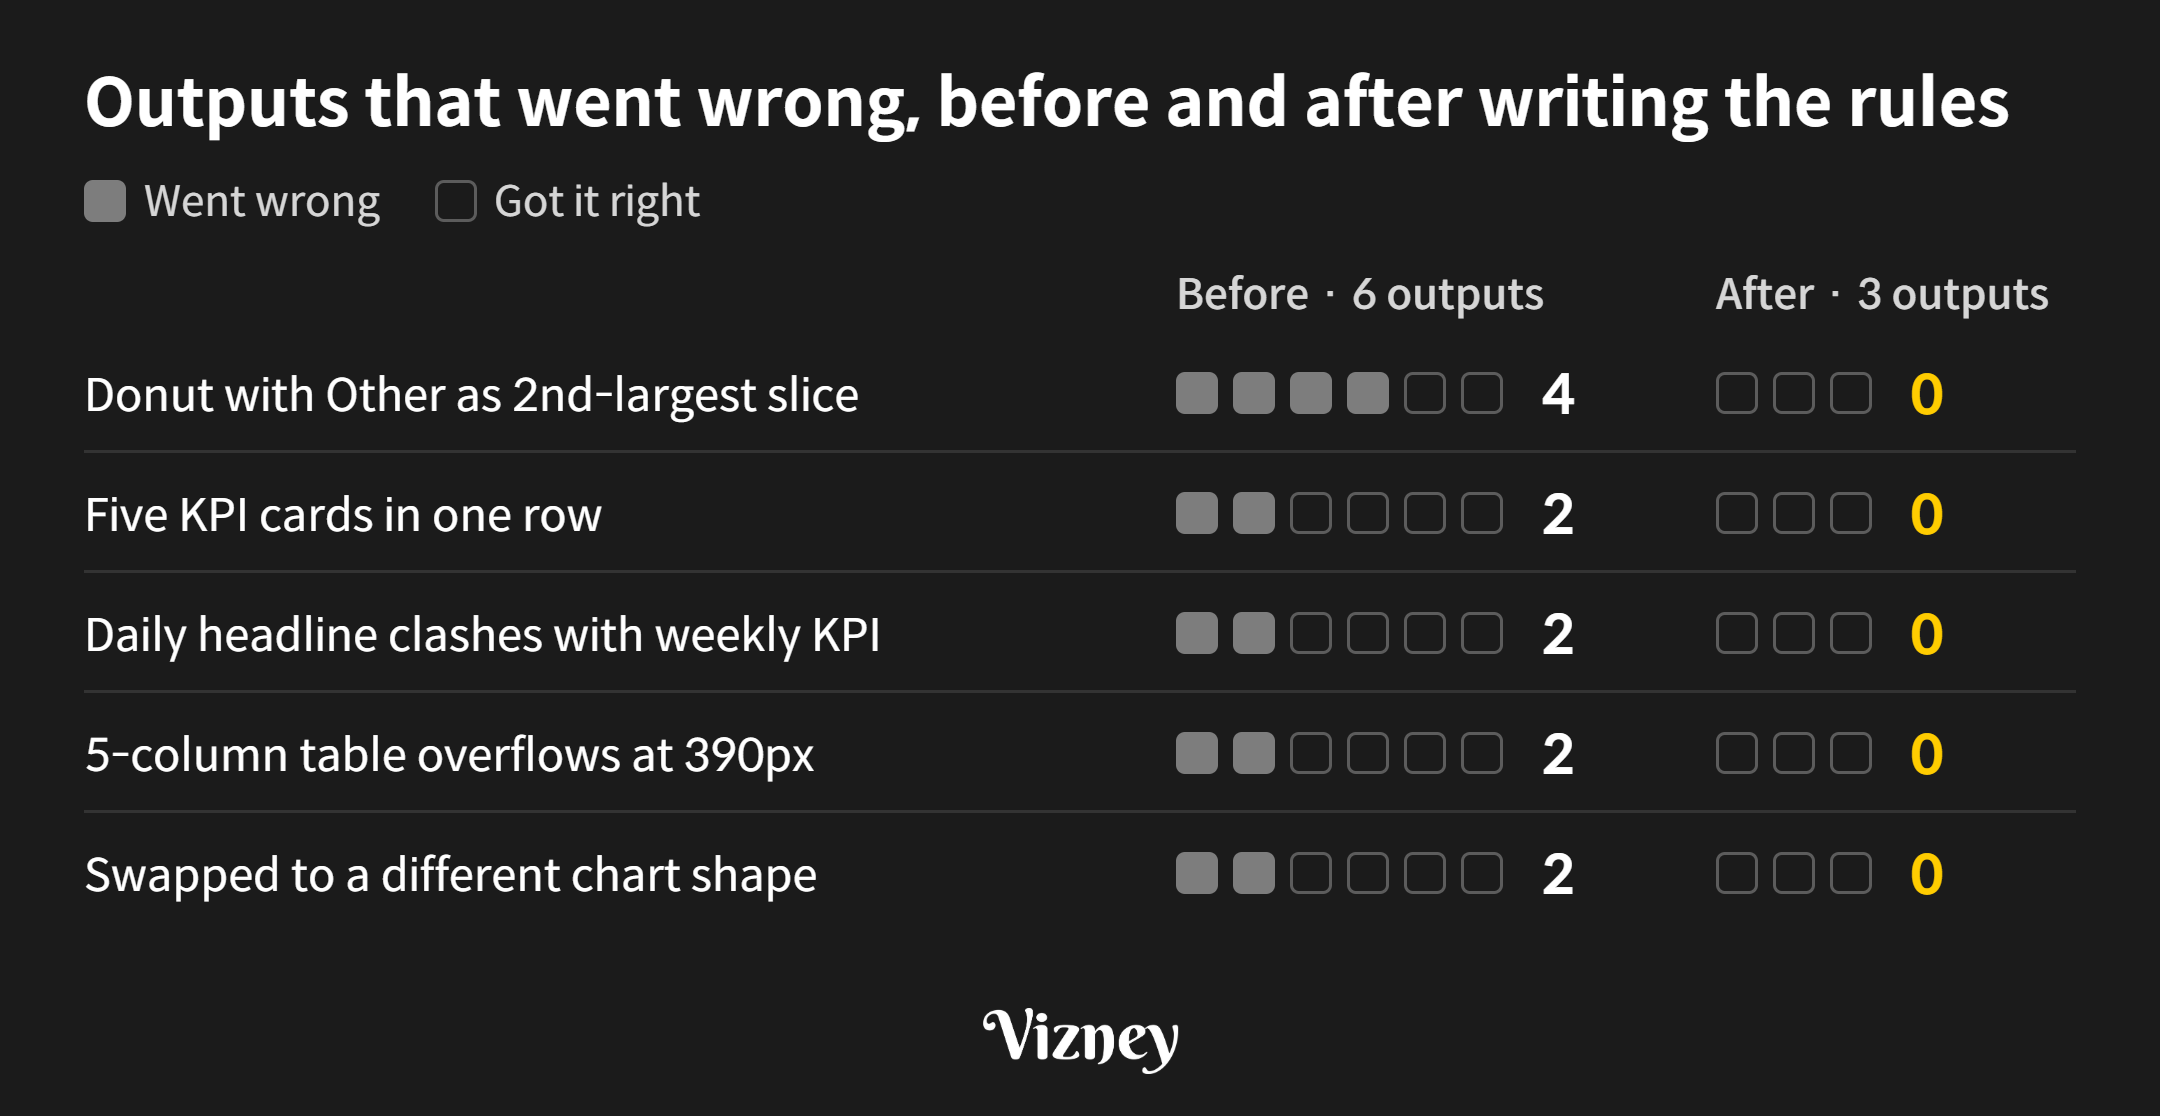
When we rebuilt the same three requests, all five problems in the figure were gone from the three new outputs. All three outputs asked for a pie chart switched to bars and explained why. We also refined the rules to cover three remaining gaps in the layout.
If "decision, cards, first screen" settles what to show, how to chart and arrange it is also judgment the data doesn't contain. In this test, once that judgment was written down with reasons, AI followed it. When a request and a screen people will actually use point in different directions, it's better to have AI change course and explain why than to follow the request as is.
4. What should you decide before handing it to AI?
In practice, write down three things for each dashboard and put them in the prompt:
- Decision: In one sentence, who looks at this screen and what they decide. If it doesn't fit in one sentence, confirm the screen is needed at all.
- Cards: For each chart and table on the screen, the question it answers and the comparison that delivers the verdict. Drop cards without a question.
- First screen: The verdict cards that must be visible without scrolling where people actually view the dashboard.
If you've settled how cards should be chosen and arranged, put those rules in the prompt too, with the reasons.
Writing a prompt that contains these answers is dashboard planning. Once the planning is set, AI can build the layout and apply the style quickly. Whether you build Tableau dashboards with AI or web dashboards with AI, screen quality is decided by this planning.
The choosing-and-layout rules from this test are published in the Vizney Blocks skill. AI coding agents can install it with:
npx skills add yehwanhwang/vizney-blocksSample company dashboard styles are available at Vizney Styles. If you need dashboard planning alongside a style, send your dashboard list, who uses each one, and the decisions they make through the contact page.