How to use Custom Number Formatting in Tableau

When building visualizations in Tableau, there are times when you need precise control over how numbers are displayed. For example, you may want to simplify figures by displaying them in millions, add specific suffixes, or format negative numbers with parentheses. To meet these needs, Tableau provides the Custom Number Formatting feature. With this tool, you can control the visual representation of numbers in a highly intuitive way.
Custom number formatting can be set via the Format pane or directly at the field level. You can specify numeric display patterns according to your requirements. Below are frequently used formats and helpful tips.
Basic Structure
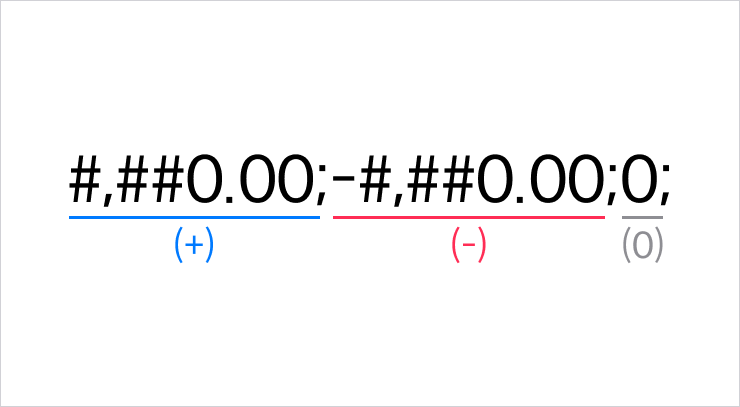
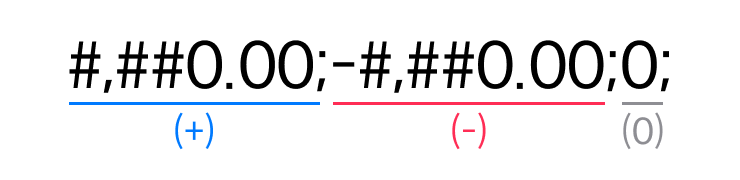
Custom number formats in Tableau allow you to define separate formats for positive numbers, negative numbers, zero values, and null values, using semicolons (;) to separate each section.
Meaning of Key Symbols
The table below explains the meaning of each formatting symbol:
| Symbol | Meaning | Example | Description |
|---|---|---|---|
# |
Displays a digit only if one exists | 12 → ### → 12 |
Zeroes are not shown |
0 |
Displays a digit or a zero if none exists | 12 → 000 → 012 |
Forces fixed digit width |
, |
Thousands separator or unit scaling | 1,200 → #,##0, → 1.2 |
Adds commas or scales value |
. |
Decimal point | 2 → 0.00 → 2.00 |
Controls decimal places |
; |
Conditional separator | #,##0;(#,##0) |
Distinguishes formats |
% |
Percentage format | 0.5 → 0.0% → 50.0% |
Multiplies number by 100 |
" |
Literal text wrapper | 5 → 0"hours" → 5hours |
Adds text before/after numbers |
While format codes like Y, M, D exist for date-style formatting, they are rarely used. For converting numbers to dates, it’s generally better to use calculated fields instead.
Curious about how number-to-date formatting works? See our post below for details.

Basic Format Examples
These are essential building blocks for understanding custom number formatting:
| Format | Meaning |
|---|---|
#,##0 |
Integer with thousands separator |
#,##0.00 |
Displays two decimal places |
#,##0,,M |
Displays in millions (e.g., 1,000,000 → 1M) |
#,##0.0% |
Percentage with one decimal place |
+#,##0;-#,##0 |
Adds + for positive, - for negative values |
Commonly Used Formats
Below are practical formats often used in real-world dashboards. Adapt them as needed:
| Format | Description |
|---|---|
#,##0,,.0M;-#,##0,,.0M |
Displays values in millions with one decimal place (e.g., 1,200,000 → 1.2M) |
▲0.0%;▼0.0%;"-" |
Visualizes percentage changes using arrows |
"#"000 |
Displays a sequence with a fixed prefix |
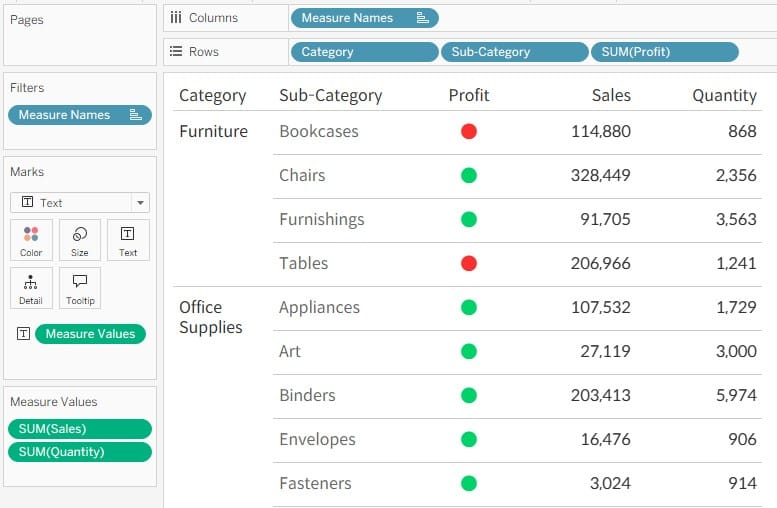
🟢;🔴 |
Shows KPI status with green/red emoji indicators |