
Netflix Dashboard Style — Dark, Cinematic, Bold
A Netflix-style dashboard on black: one red, and Netflix's Top 10 parts instead of charts. The sample is a fictional weekly ticket sales report from Vizney Live.

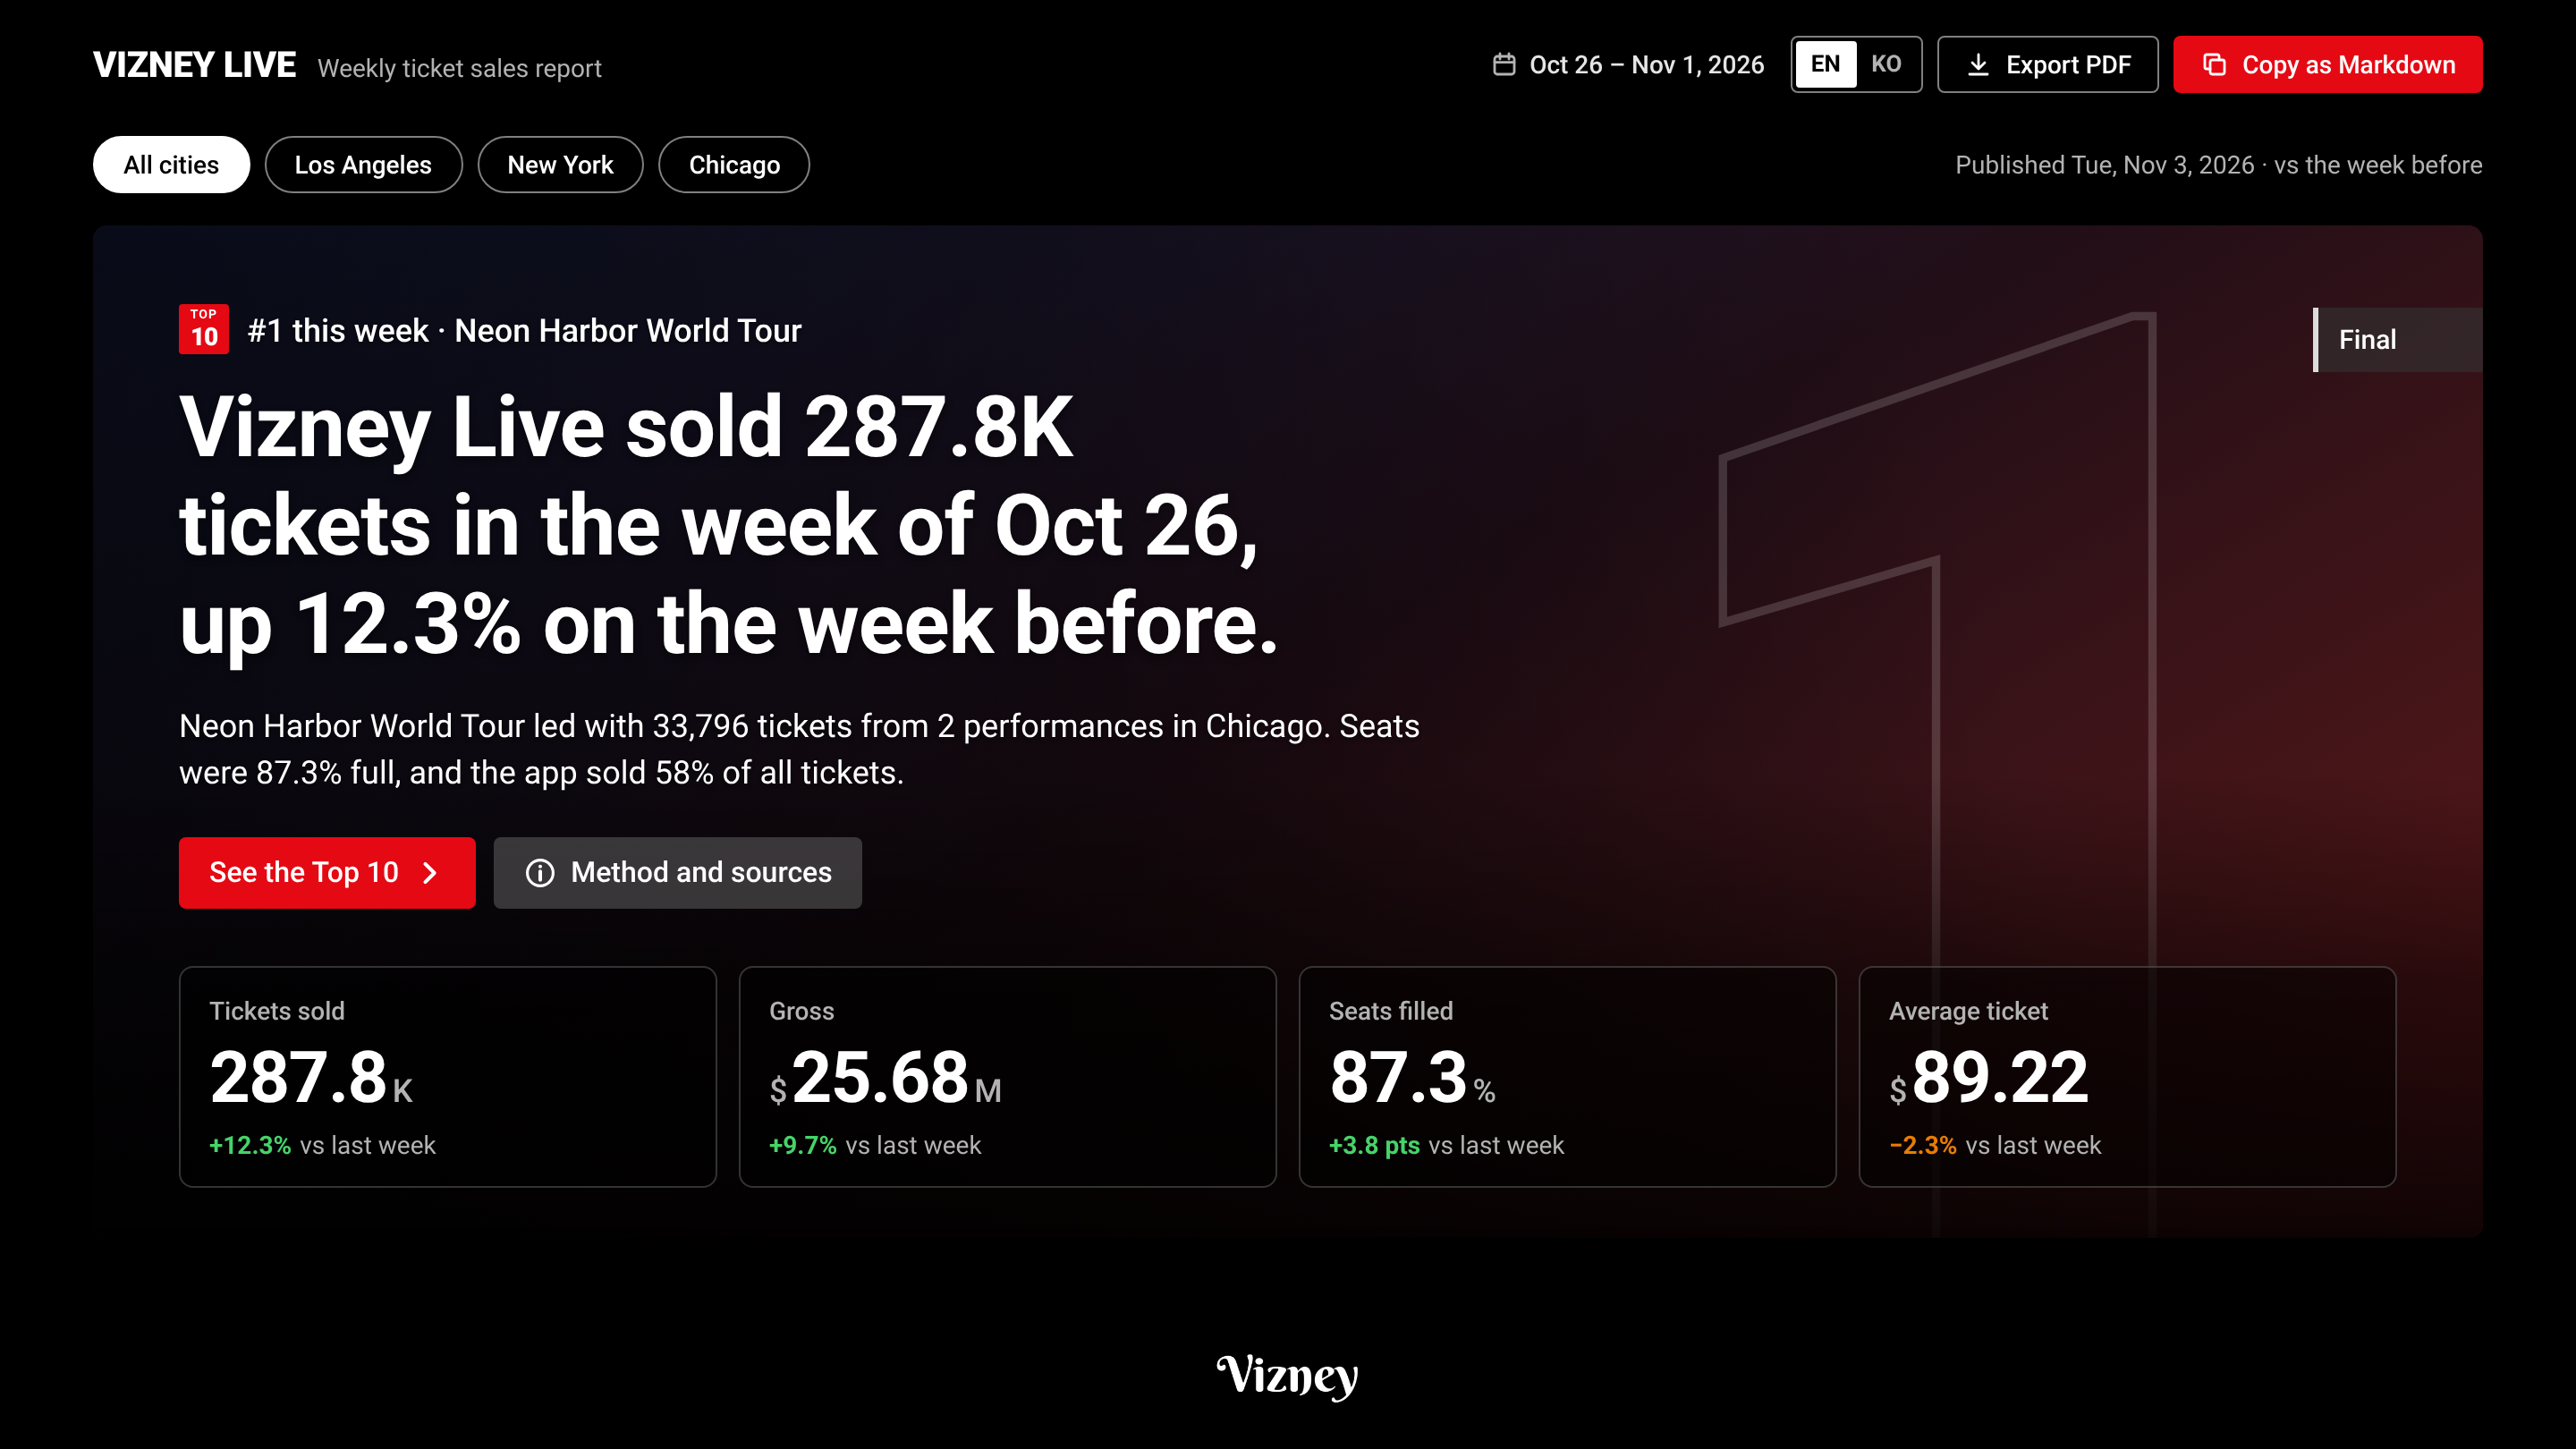
A Netflix-style dashboard on a black page: one red, and rankings told with numerals and posters. It takes the measured CSS tokens of netflix.com and the parts Netflix uses instead of charts (the billboard, a Top 10 ranked with outlined numerals, weeks in the Top 10, an episode list with progress bars, the weekly Top 10 table, frequently asked questions) as one card and one chart grammar.
The sample below is a fictional weekly ticket sales report from Vizney Live. The city filter at the top changes every card.
Design
- Color: a black page
#000000with#161616cards and one red subject,#f0313b, in the data; the rest is gray. The UI red#e50914stays on buttons and TOP 10 badges. - One card: every figure and table follows figure label → a title that states the finding → subtitle → key → chart → note.
- Type and numbers: Roboto, Top 10 values in full digits (33,796), and negative signs are a true minus (−).
DASHBOARD.md
Add DASHBOARD.md, the agent skill, Tableau palettes and a Power BI theme to your project folder with one command.
npx @vizney/styles@latest add netflix
DASHBOARD.md · Prompts · Download the zip · npm
We make the same package for your company, from your website, privately. Contact us · Want a brand in the catalog? Request it on GitHub and vote with 👍.
Not an official Netflix design, and not affiliated with or endorsed by Netflix. A reference style read from the publicly visible design of netflix.com; it carries no logo, typeface or data of theirs. Trademarks belong to their owners. The sample's company, Vizney Live, and all its numbers are fictional.