
Tile: A Dashboard Style with Airy White Cards and Blue–Mint Rings
Tile is a dashboard style that lays plain white cards out like clean tiles on a pale blue-gray canvas and shows the numbers in blue and mint rings. Try the sample built on operations data from a fictional boutique hotel with three properties.

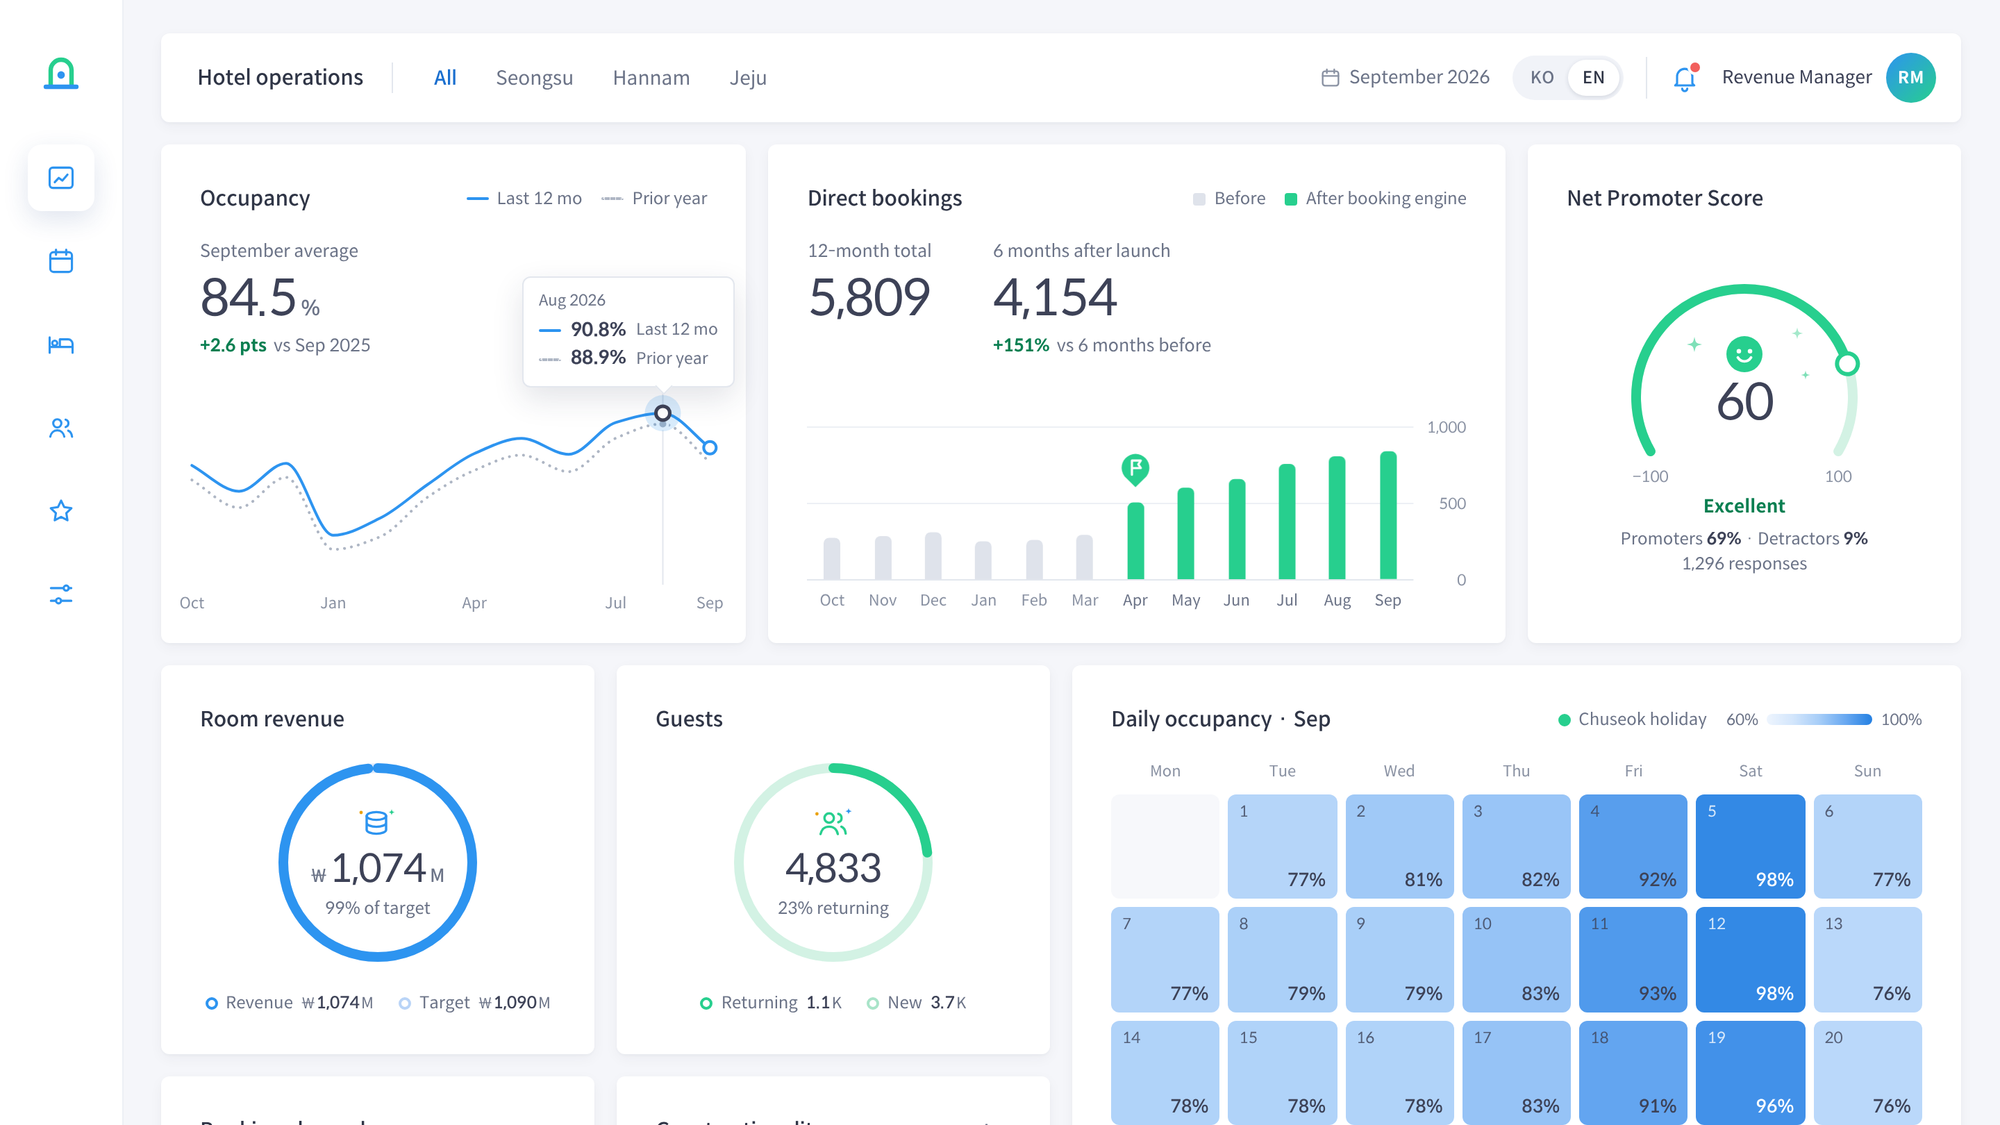
Tile is a dashboard style that lays plain white cards out like clean tiles on a pale blue-gray canvas and shows the numbers in thin lines and blue and mint rings. The sample covers September 2026 operations for a fictional boutique hotel with three properties. Switch properties with the tabs at the top, and hover over a chart or use the arrow keys to read the values.
Design
- Cards are plain white, with no border or fill and only a faint shadow. The pale blue-gray canvas is the only tint and the gaps are even, so the cards read like a neat row of white tiles: light and orderly.
- The data uses two colors. Trends and targets are blue, the highlighted period and shares are mint, and comparisons step back as a gray dotted line and gray bars.
- Figures are not bold. A large regular-weight figure carries a small unit, and the change sits on the line below, so figures line up from card to card.
- Lines and rings keep it light. An edge-to-edge curve, hollow markers, and round-capped rings and a gauge leave room to breathe, and daily occupancy is a calendar shaded in a single blue.
Prompt
The spec covers the layout, color tokens, type, components and interaction rules. Share it and ask like this to get the same look.
Spec: https://styles.vizney.com/tile/style.html
Build a store operations dashboard as a single HTML file in the Tile style.
Spec: https://styles.vizney.com/tile/style.html
Data: the attached CSV (monthly sales, visitors and targets by store)
Layout: store tabs at the top, monthly sales trend, target ring, daily visitor calendar
Need a dashboard in this style? Contact us.