
Difference Between 'Show Empty Rows' and 'Show Missing Values' in Tableau

When using [Show Missing Values] or [Show Empty Rows] to visually pad missing dates in Tableau, users often get frustrated when the dates don't automatically fill from the 1st to the 31st of the month.
The first universal principle to understand is that Tableau’s padding does not automatically fill a standard calendar. It strictly fills the gaps between the Minimum (first) and Maximum (last) dates present in your current data.
So, how do these two features differ? The core difference lies in how they react when you use filters to adjust those Min/Max boundaries.
Show Missing Values
Right-click the date pill
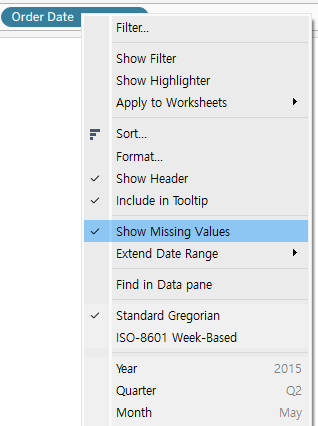
- Behavior: It relies on the data currently rendered in the view.
- Filter Application: It responds seamlessly to standard Dimension Filters. When you narrow down the date period using a filter, the minimum and maximum dates displayed on the screen change, and the padded range adjusts dynamically to match.
Show Empty Rows/Columns
[Analysis] > [Table Layout]
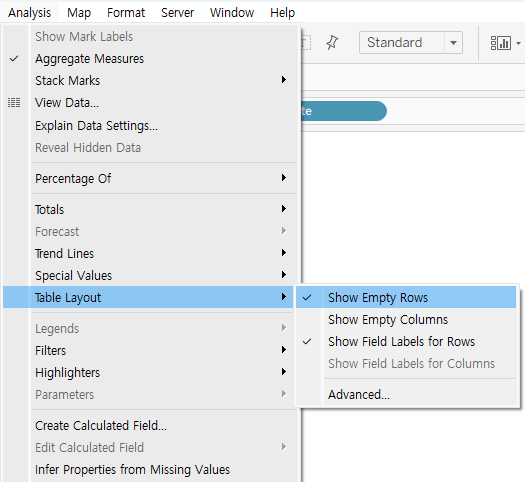
- Behavior: This evaluates structural boundaries before the data is fully rendered on the sheet.
- Filter Application: Standard dimension filters cannot adjust its padding boundaries. To explicitly cut or expand the start and end dates for this feature, you must right-click your date filter and select [Add to Context]. Elevating it to a Context Filter forces it to process before the Table Layout renders.