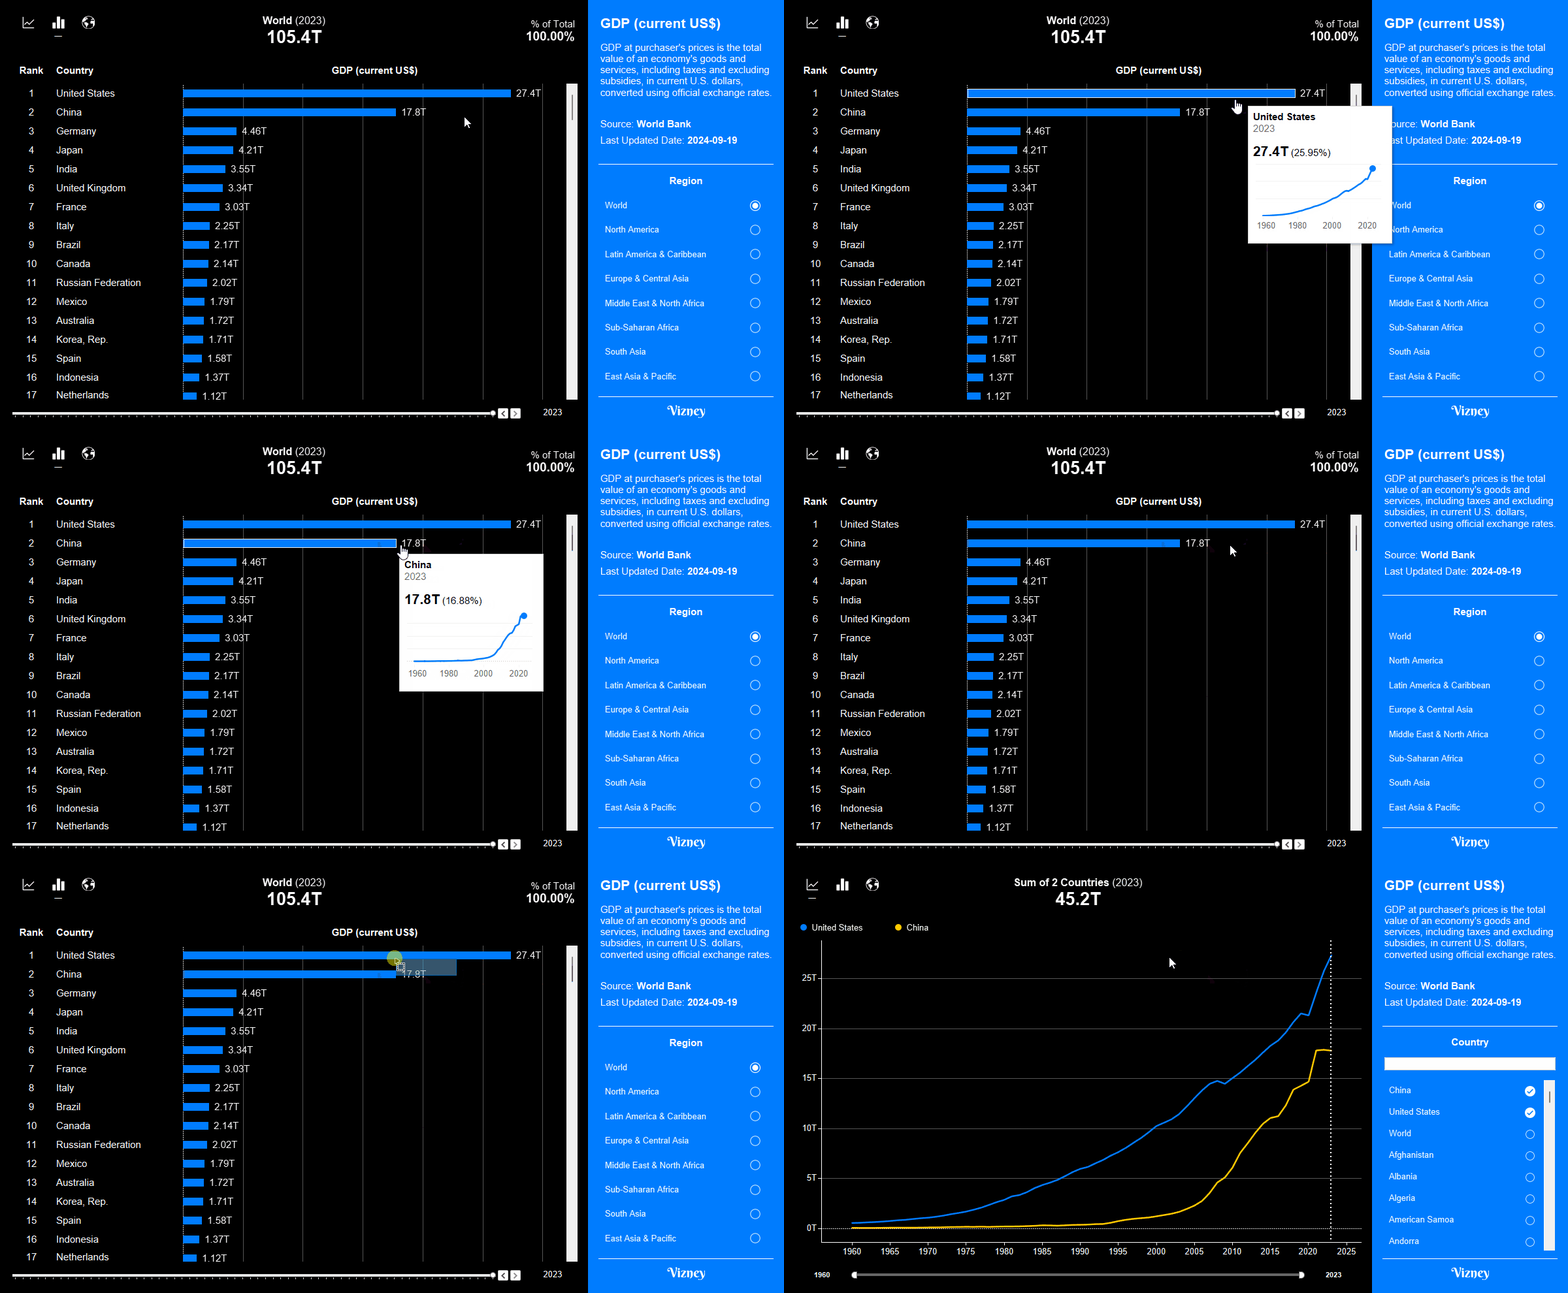
Recreating Tableau Public Dashboards in HTML (feat. Claude)
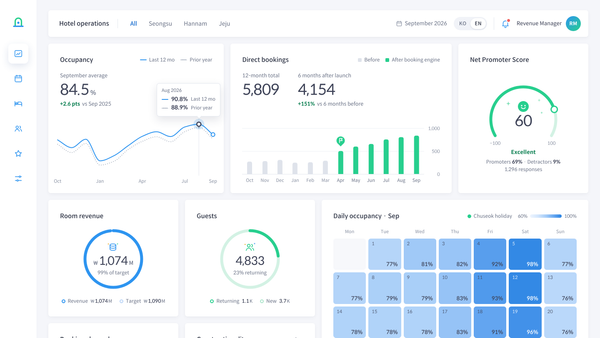
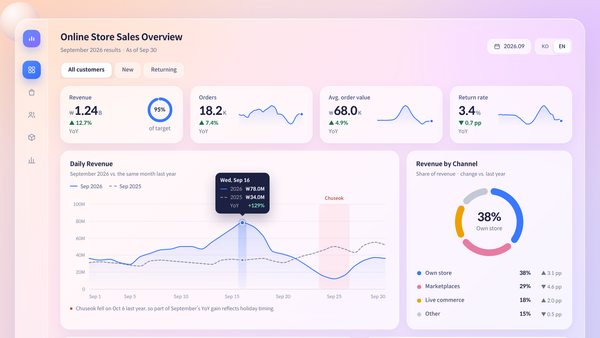
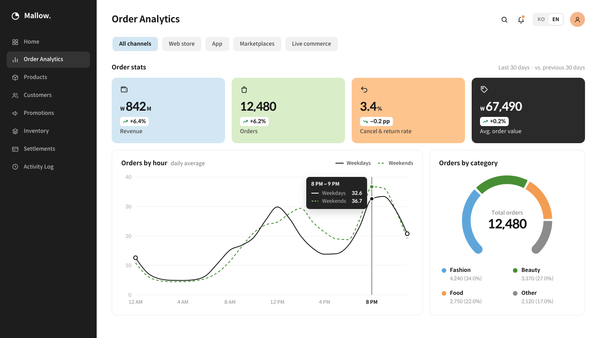
This interactive HTML dashboard was built using Claude, referencing Tableau's benchmark "Sample Superstore" dataset alongside a well-designed reference dashboard from Tableau Public. It runs independently in any modern web browser without requiring a BI platform.
The design benchmarks the dark-themed card layout, executive KPI summary, and hierarchical visualization structure found in P. Padham's dashboard, a past Tableau Public Viz of the Day pick.
Prompt
Tableau Public has a lot of well-designed dashboards. I want to use one
as a reference and build a working, data-connected HTML dashboard
inspired by it.
Please analyze the structure of the Tableau Public dashboard below
(layout, KPI cards, chart composition, interactions) and turn it into
an interactive HTML dashboard that runs on the attached Sample
Superstore dataset. It should perform real aggregation and filtering
on the data, not just look like a static image.
Reference dashboard: P. Padham, "Superstore Dashboard" (Tableau Public)
https://public.tableau.com/views/SuperstoreDashboard_16709573699130/SuperstoreDashboard